Watching For CRE Inflection Points Amid Shifts in Policy: Q1 Chartbook
Watching For CRE Inflection Points Amid Shifts in Policy: Q1 Chartbook
Commercial real estate chartbook: Q1
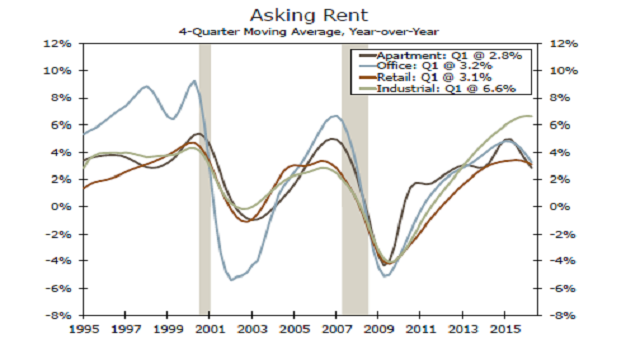
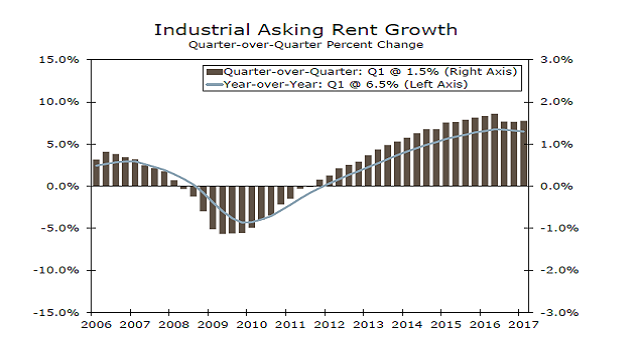
CRE Property Pricing & Fundamentals Operating fundamentals improved in Q1, albeit
at a slower pace. Asking rent growth for industrial was unchanged in Q1, rising a solid
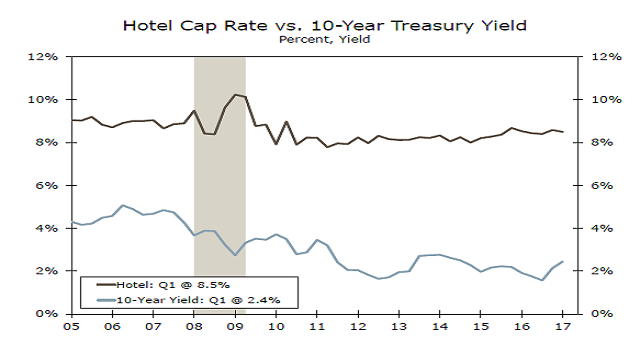
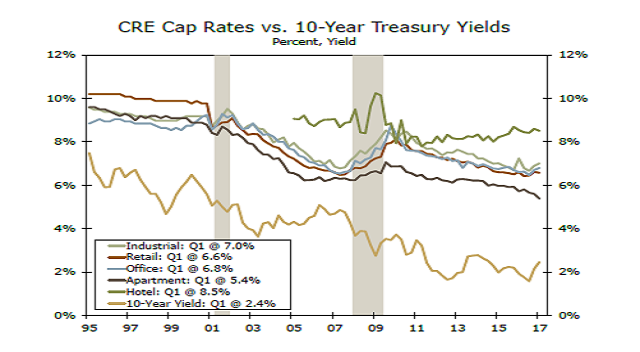
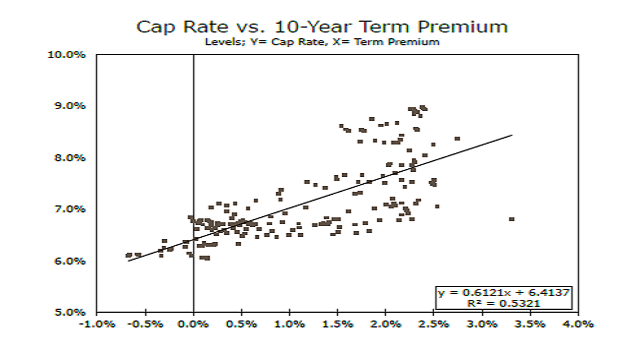
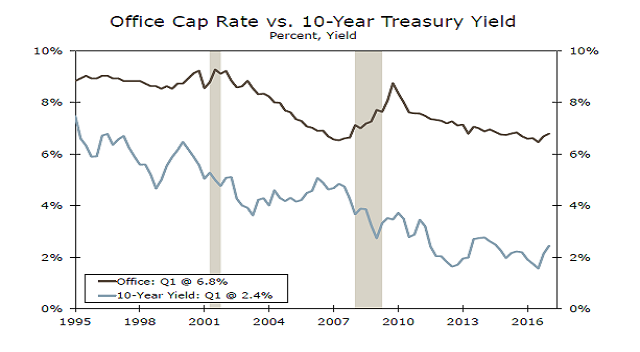
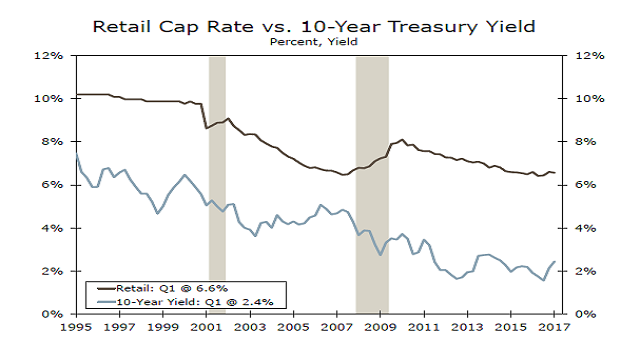
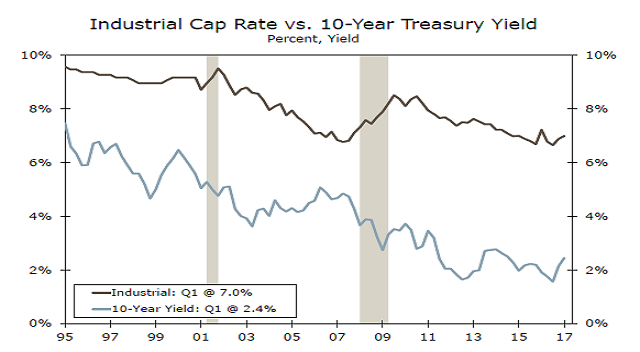
6.6 percent, while apartment and office eased. With the exception of office, cap rates fell for all
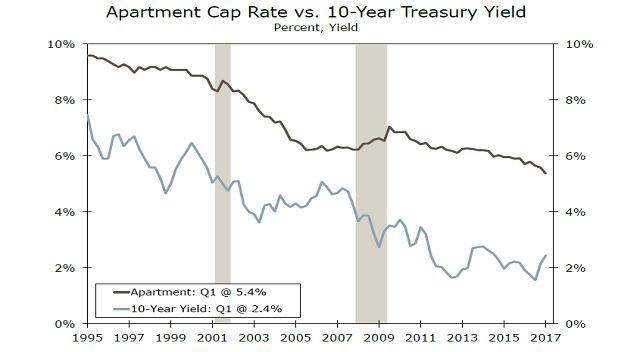
property types in Q1, with the steepest decline in apartments, down 30 bps. The spread
between the all-property cap rate and the U.S. Treasury yield remains about 400 bps.
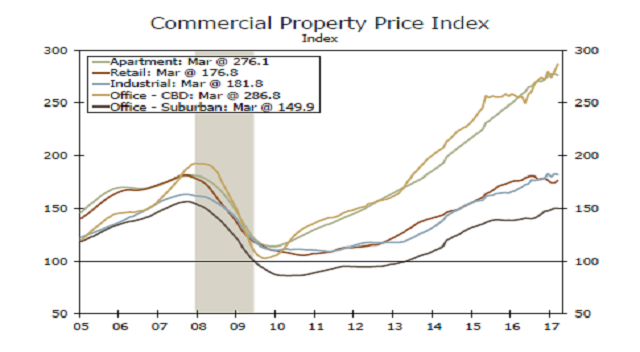
The all-property Moody’s/RCA Commercial Property Price Index (CPPI) remains elevated,
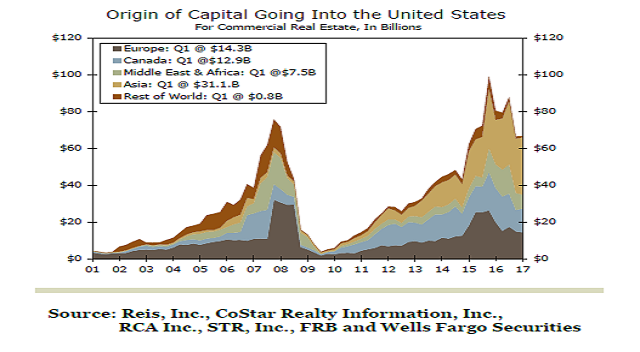
but the breakneck pace recorded in previous years has slowed. Cross-border activity into the
United States remained roughly unchanged in Q1 at $66.7 billion. Despite capital controls,
Chinese CRE transactions nearly doubled in Q1 relative to the same quarter a year earlier.
Apartments
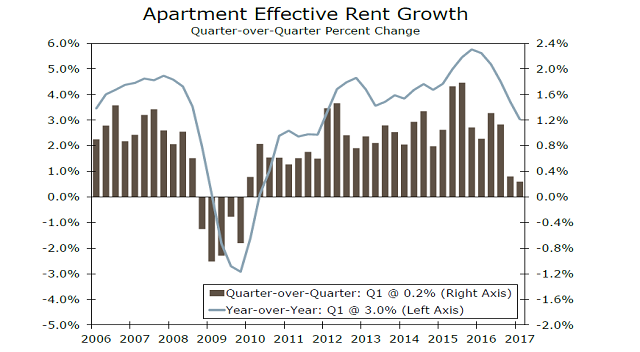
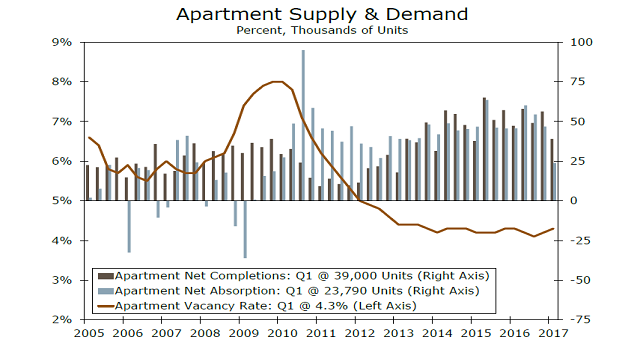
Apartment fundamentals softened in Q1 with the national vacancy rate rising to 4.3 percent.
Net absorption registered its lowest level since Q4 2009, while supply has surpassed demand
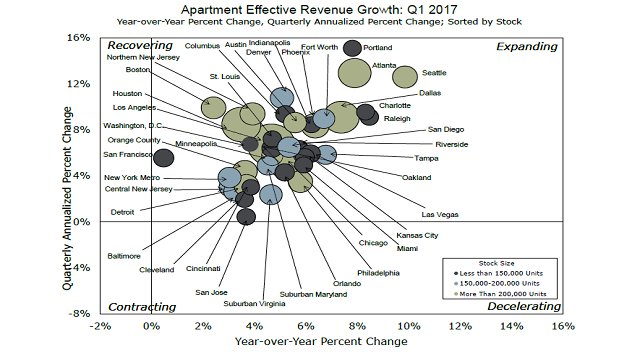
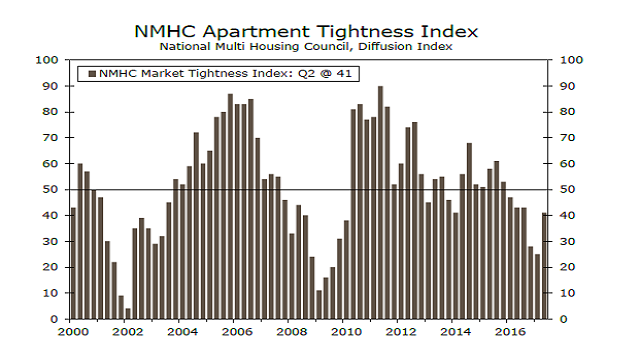
for two straight quarters. Effective rent growth continues to run ahead of inflation; however, the year-over-year pace of growth has slowed to 3.0 percent—slowest pace since Q4 2011. Annual effective rent growth declined for the second consecutive quarter in San Francisco and New York, whereas less tech driven markets, such as Colorado Springs and Nashville, are leading the nation in rent growth. The NMHC Apartment Tightness Index rose in Q2 but was below the 50-line for a sixth-straight quarter, indicating softer market conditions.
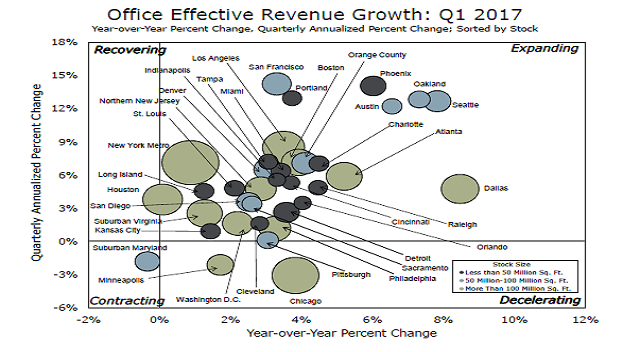
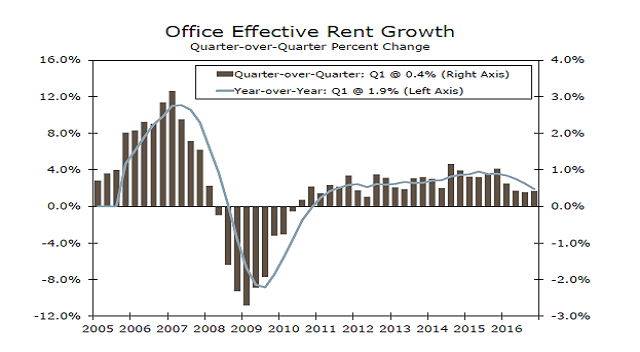
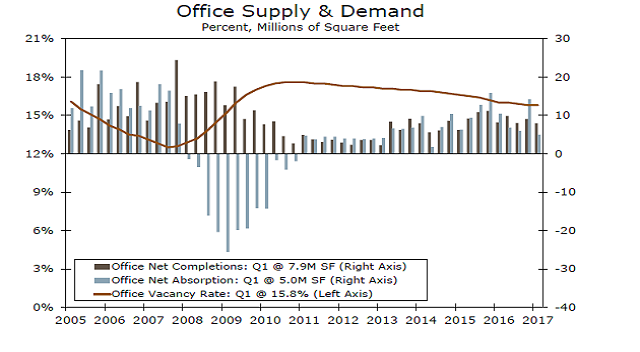
Office
Office fundamentals grew at a slower pace in Q1 with the national vacancy rate remaining
unchanged at 15.8 percent. New supply slowed over the quarter and was met with a drop in
demand. Year over year, effective rent grew at a sub-2 percent pace in Q1, which is the slowest
pace since Q3 2011. Oakland and Seattle are still seeing effective rent grow north of 5 percent. According to Colliers, suburban office markets are driving much of the current absorption as
employers seek less expensive Class A space. Rent growth for suburban Class A properties
increased 3.0 percent year over year, compared to CBD, which grew 4.1 percent. Class A CBD
rent growth in the South outpaced other regions, up 6.6 percent year over year.
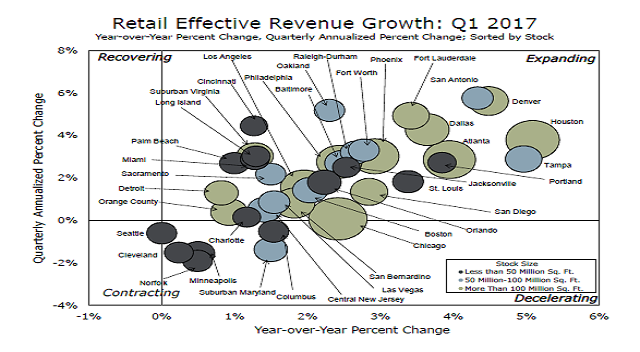
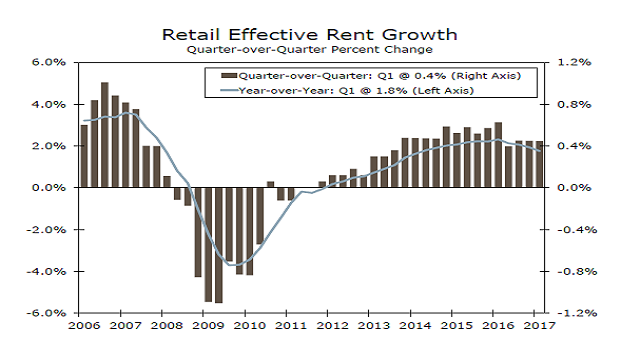
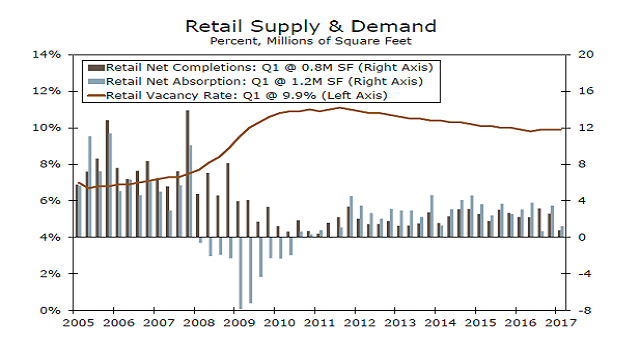
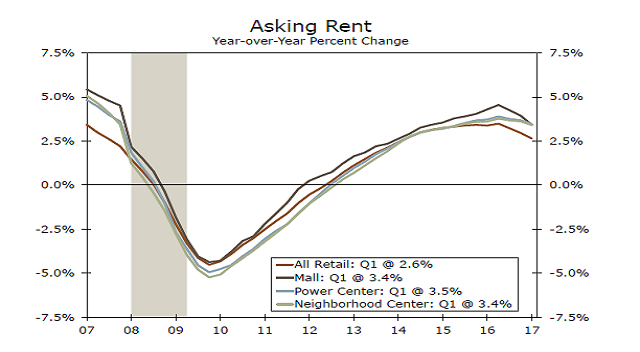
Retail
Activity in the retail sector in Q1 2017 could best be described as quiet. Completions and absorption were both muted during the quarter, with deliveries hitting the lowest level in almost six years. Rent growth slowed to 1.8 percent. The evolving retail landscape has been well publicized with big brand store closings partly due to the growth in e-commerce. However, vacancies and rents have been propped up by low levels of new construction as well as new retailers filling the vacated spaces. Year-over-year asking rent growth slowed in all retail sectors for the third quarter in a row,
indicating that Q2 2016 could have been a potential inflection point in the sector.
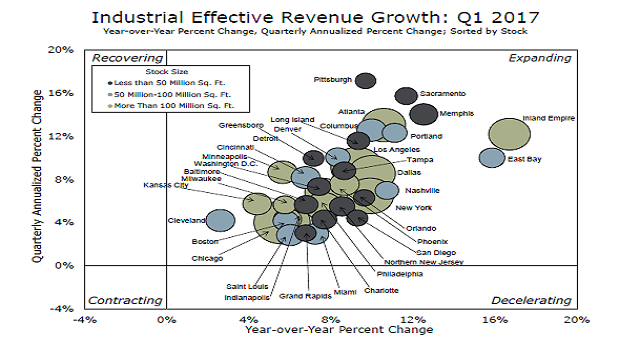
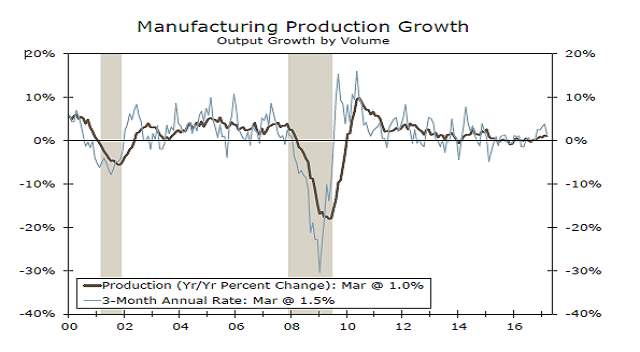
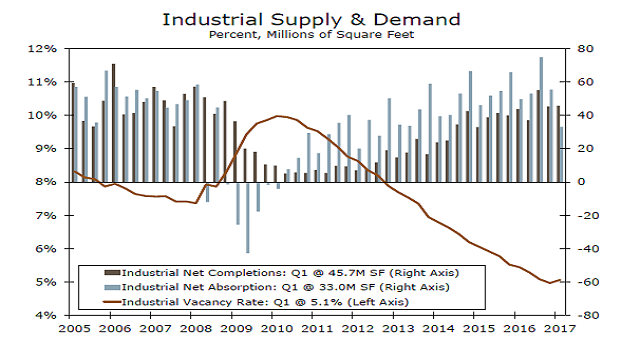
Industrial
For the first time in 28 quarters, the level of net completions outweighed net absorption in the
industrial sector; however, historically, the first quarter typically sees the lowest growth. Cap
rates increased in Q1, but transaction volume was also weak during the quarter. Vacancy rates remain low, particularly in manufacturing centers, with solid net absorption since Q2 2016 consistent with the quarterly uptick in manufacturing output. Slowing new construction has also contributed to strong rent growth and low vacancy rate. Nearly all absorption in the sector is coming from large distribution centers, primarily due to the continued emergence of e-commerce.
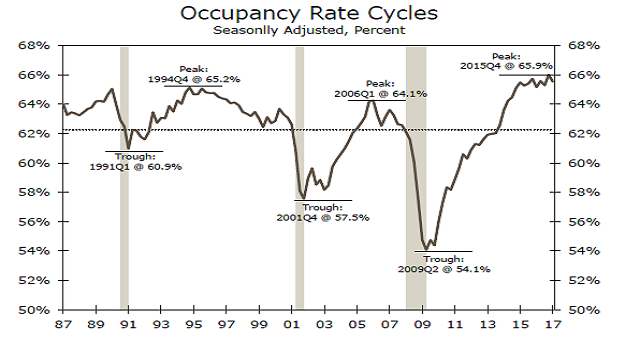
Hotel
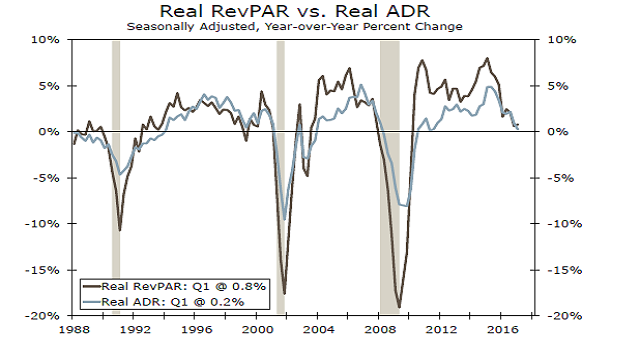
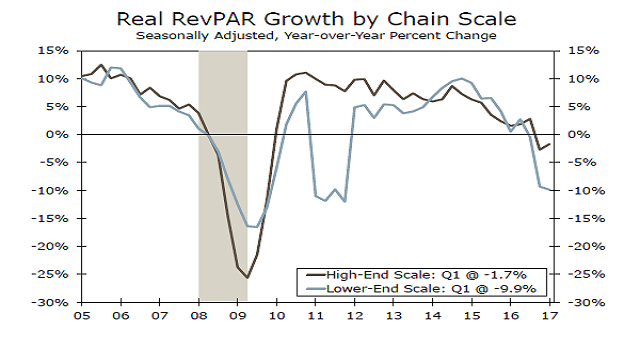
Against all odds, seasonally adjusted real revenue per available room (RevPAR), which is
the product of occupancy and the real average daily rate (ADR), has remained in a narrow
range since late-2014, coming in between roughly $75 and $80, with the level still at a
record high. That said, the pace of growth has slowed to just 0.8 percent, well off its peak.
Real RevPAR for lower-end hotels (mid- and economy-scale), posted its third straight yearover-
year negative reading in Q1, while the pace for higher-end hotels (luxury, upper upscale and
upscale), is showing signs of improving. In part, the recent uptick in higher-end hotels is
consistent with the rise in post-election sentiment, which will likely not be sustained.