CRE Deal Volume Shows Late-Cycle Behavior: Q2 Chartbook
CRE Deal Volume Shows Late-Cycle Behavior: Q2 Chartbook
CRE Property Pricing & Fundamentals
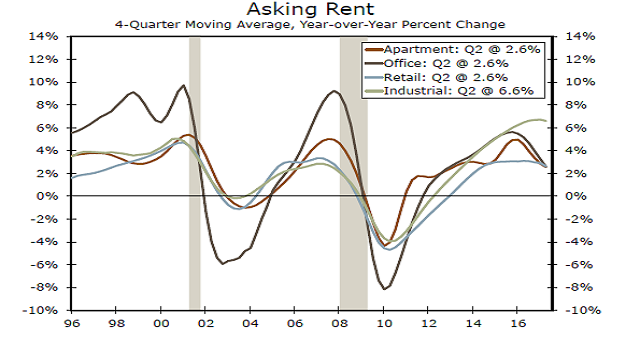
Operating fundamentals improved in Q1, albeit at a much slower pace. Year-over-year asking
rent growth for office, apartment and retail fell below 3.0 percent in Q2, while industrial
registered another quarter of solid growth. Industrial was the only sector to post an increase
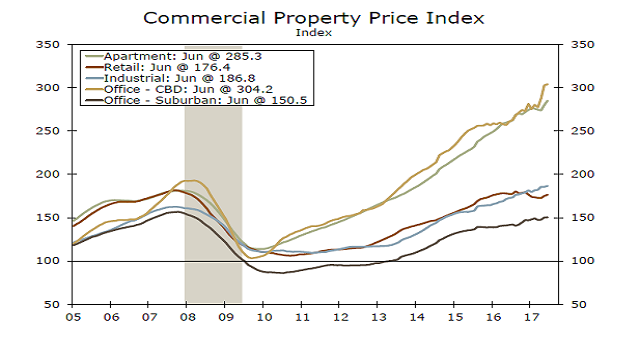
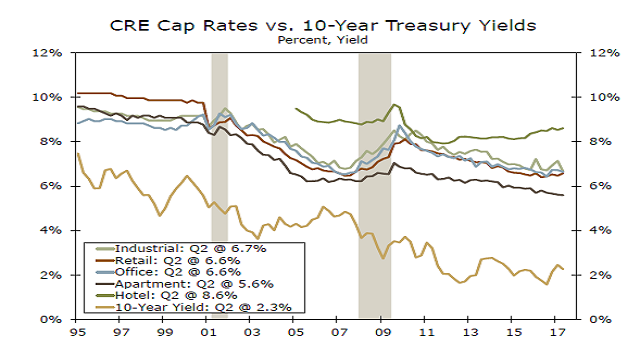
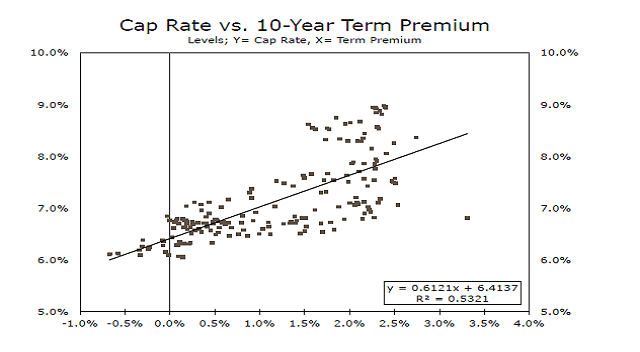
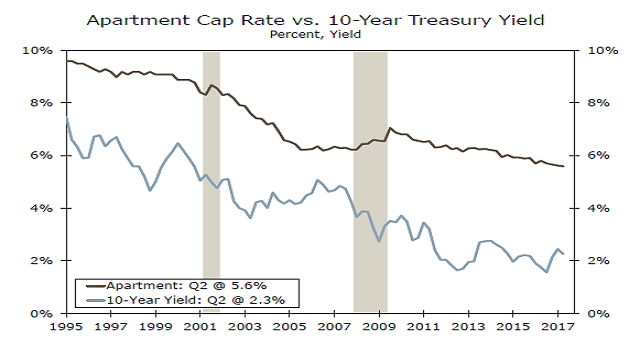
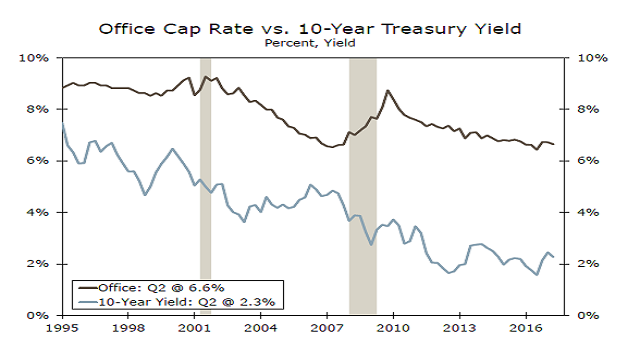
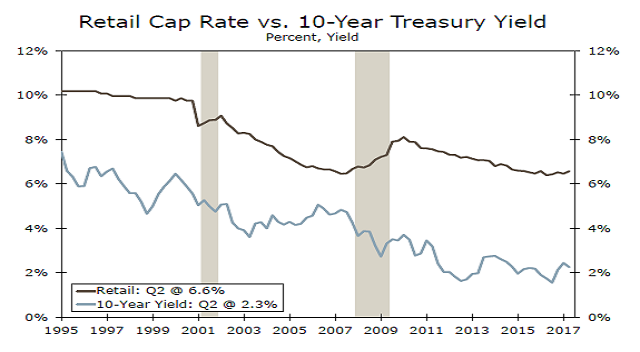
in occupancy in Q2. Cap rate results were mixed in Q2, with the all property level easing on the month on the back of compression in the apartment and industrial sector relative to the same quarter a year ago. Average office cap rates were relatively unchanged, while retail was up on the year. The Moody’s/RCA Commercial Property Price Index (CPPI) grew in H1 with office CBD
registering the strongest yearly pace of growth, while retail was the only sector that fell.
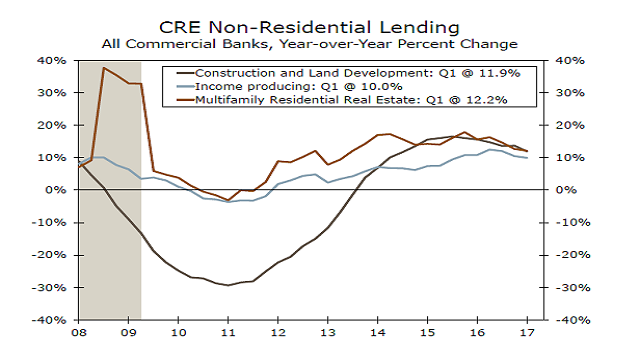
Credit Availability & Lending
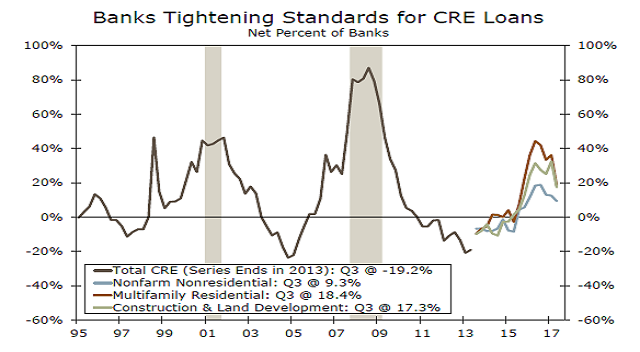
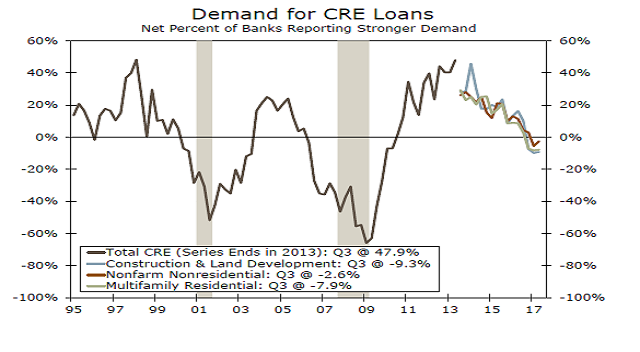
Senior loan officers reported that CRE lending standards tightened across the three categories
while demand cooled during Q2. A net share of around 17 percent of banks, which is classified as
“moderate,” reported tightening standards for construction and land development loans and
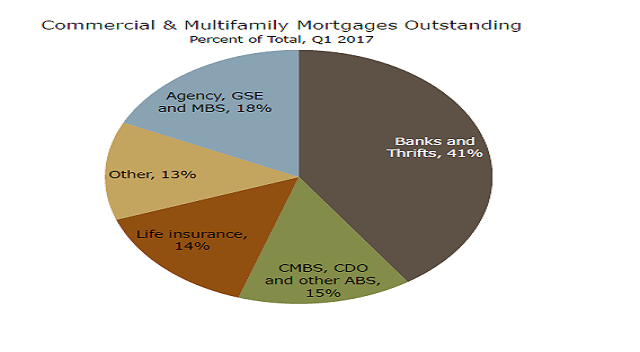
multifamily. According to the Mortgage Bankers Association (MBA), total commercial/multifamily debt outstanding broke the $3 trillion mark in Q1. At 41 percent, commercial banks and thrifts still
comprise the largest share of debt outstanding. Consistent with lending standards, loan growth
in multifamily and construction and land development has slowed from its cycle high. Growth in income properties is also moderating.
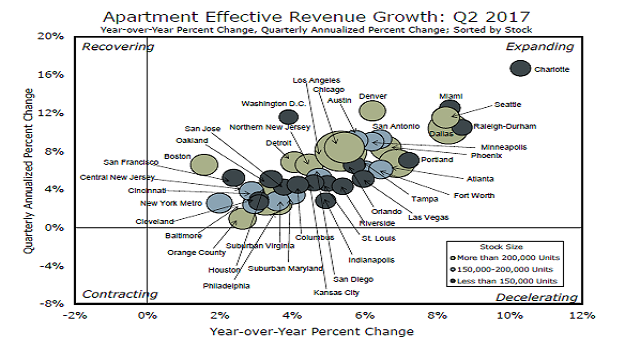
Apartments
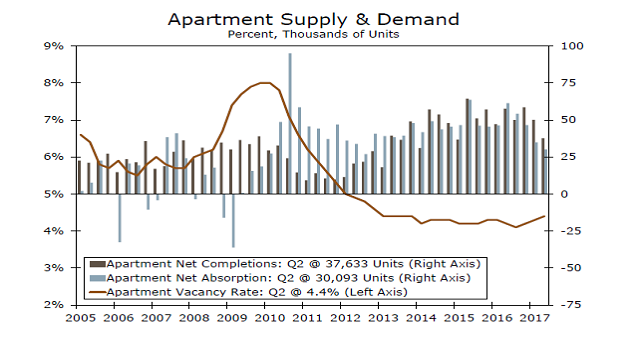
Apartment fundamentals weakened in Q2 with the national vacancy rate rising to 4.4 percent,
its highest level since Q4 2013. While net completions dropped in Q2, demand fell
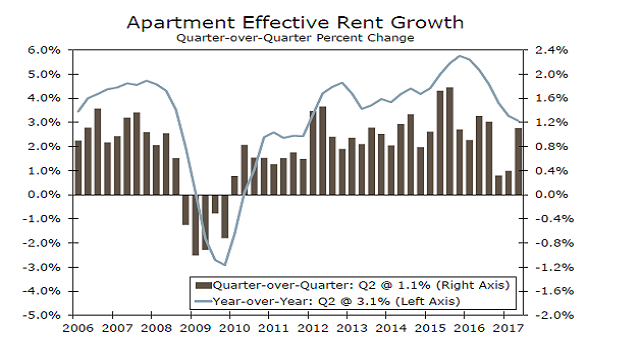
further, with net absorptions at a five-year low. Effective rent growth decelerated, slipping to its
lowest year-over-year level since Q4 2011, with major markets like Boston, New York and San
Francisco weighing on the national average. Year-over-year rent growth in these metros has
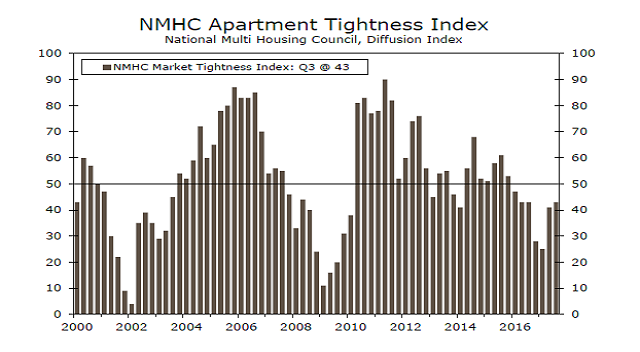
declined for six quarters. Meanwhile, southern metros led the nation. The NMHC Apartment Tightness Index stayed below 50, indicating softening in the market compared to Q1. However, the level rose from last month, reflecting a slower pace of change.
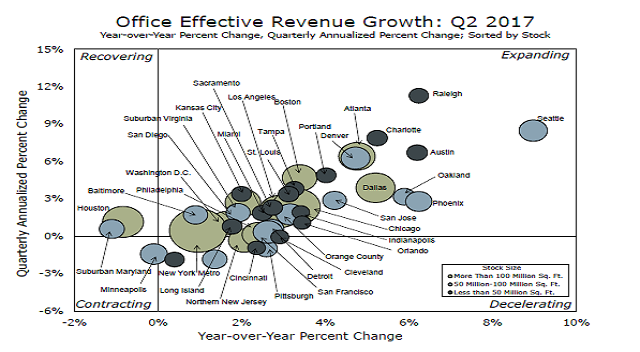
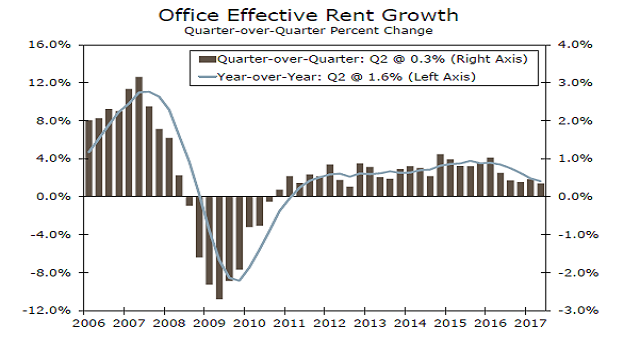
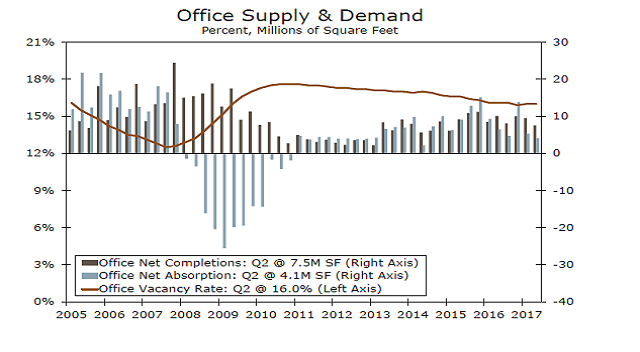
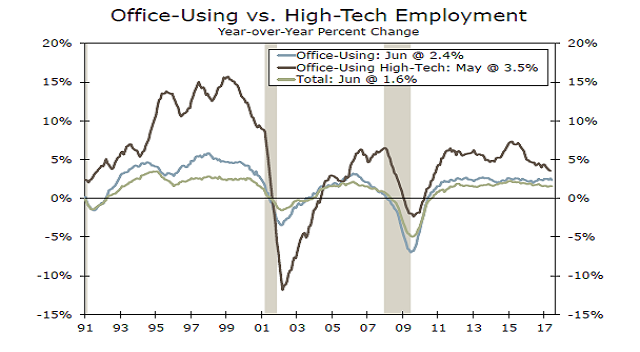
Office
The surge in office supply delivered since early- 2015 continues to put downward pressure on
effective rent growth, which slowed to just 1.6 percent year-over-year in Q2, marking the
slowest pace in six years. Although rent growth moderated in Q2, most metros posted gains
above the national average. Vacancies remained unchanged at 16.0 percent in Q2, and completions registered the lowest level in more than two years. On the other hand, occupancy rates in secondary markets like Birmingham, Charlotte, and Chattanooga fell in Q2. With the sector contending with longer-run issues like the decline in average square feet per office worker and increase in telecommuting, changes in the occupancy rate will be modest.
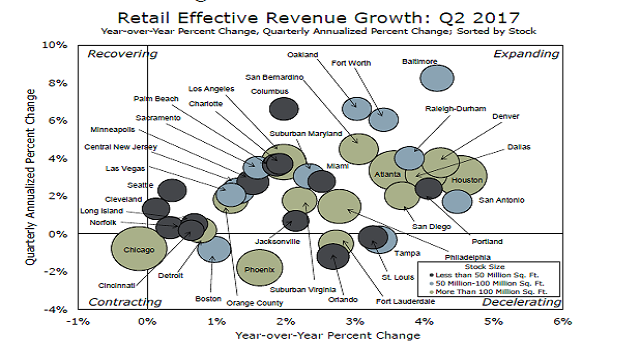
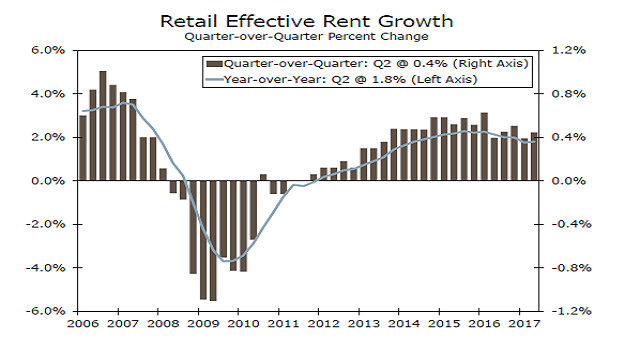
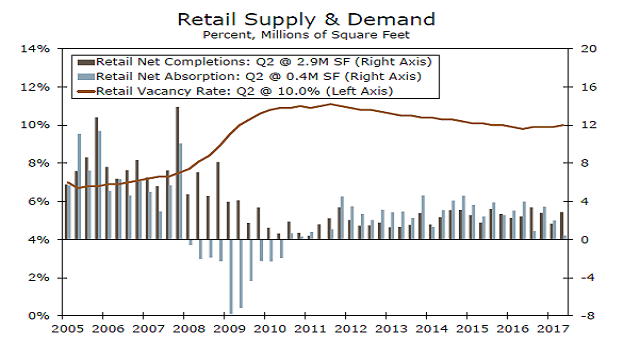
Retail
The retail sector continued its slow start to the year, matching a quiet Q1. Net absorptions fell
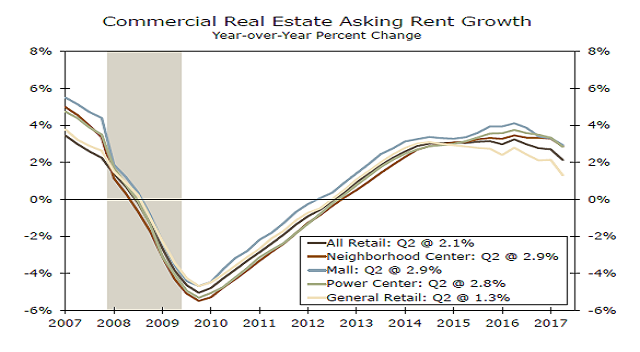
in Q2 to their lowest level since 2011, though net completions ticked up some. Rent growth stayed
flat at 1.8 percent over the year. Mall rents are rising faster than retail rents as a whole, despite worries over competition from e-commerce, as experiential tenants help support demand for mall space. Within commercial retail, power and neighborhood centers are also seeing stronger growth.
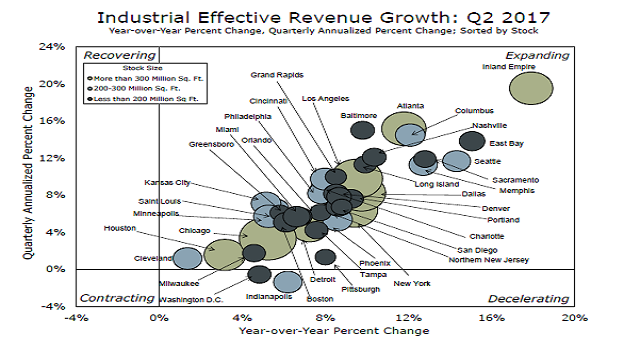
The retail sector in the Midwestern metros of Chicago, Kansas City and Cleveland is suffering,
as these areas grapple with economic and population headwinds. Strength in retail revenue growth is concentrated in the South.
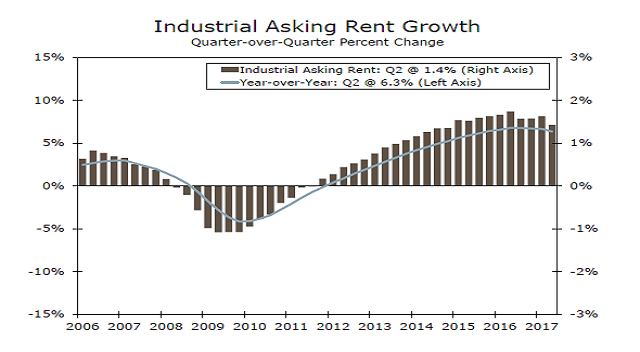
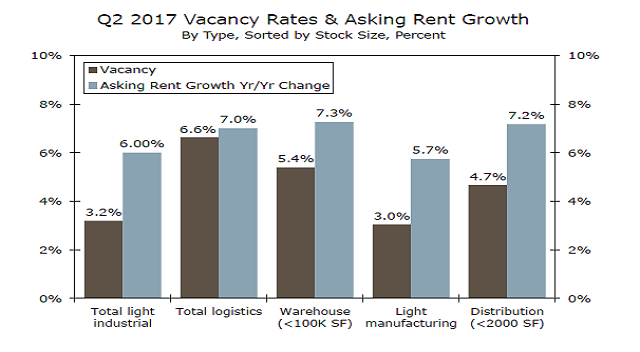
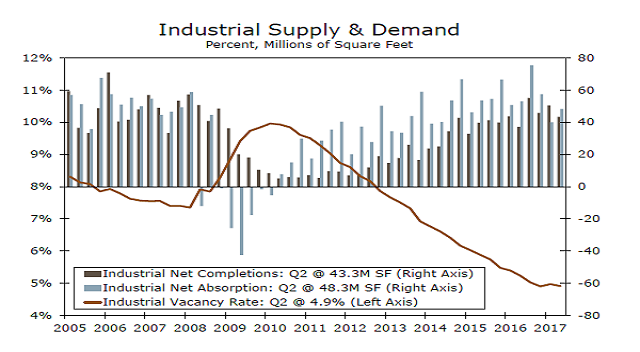
Industrial
Industrial remained the bright spot in Q2, with asking rent growing near its eight-quarter
year-over-year average at 6.3 percent. The increase in e-commerce is evident in the
stronger pace of logistics absorption relative to light industrial, with large distribution driving
the total. Asking rent growth in logistics advanced 7.0 percent in Q2 year-over-year. Overall transaction volume grew in H1 relative to a year earlier but fell on a year-ago basis.
Some of the most active markets were Los Angeles, Dallas, Chicago, Northern New Jersey
and Atlanta. However, among these markets activity was strongest in Dallas and Northern
New Jersey, but fell in Chicago.

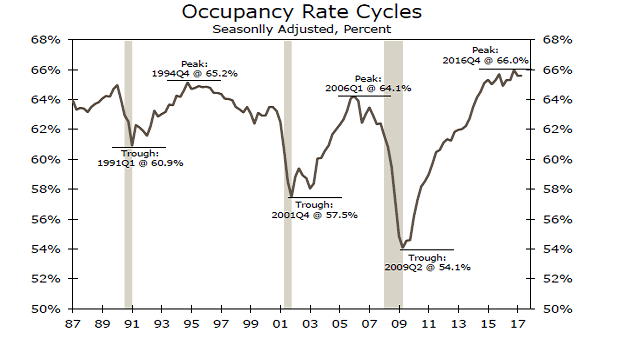
Hotel
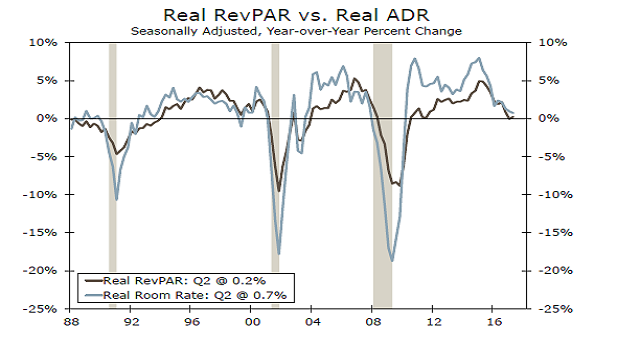
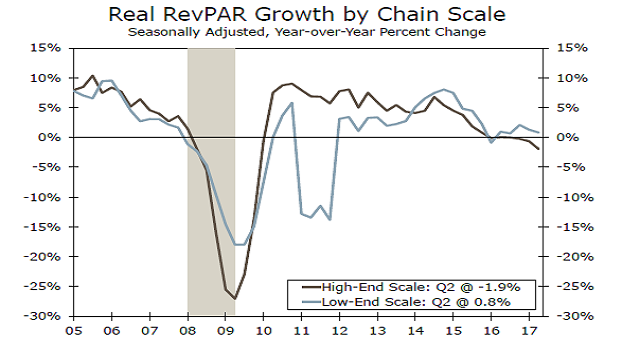
Still reflecting the previous headwind of weak corporate profits and a stronger dollar, the
seasonally adjusted real revenue per available room (RevPAR), which is the product of
occupancy and the real average daily rate (ADR), fell to just 0.2 percent in Q2, year-overyear.
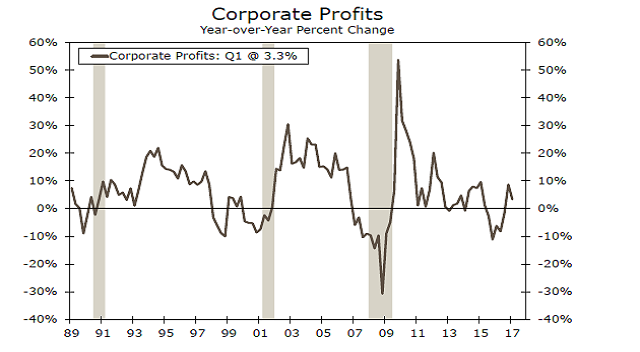
That said, corporate profits were up more than 3 percent in Q1, and the dollar is softer
suggesting there are some upside risks. Real RevPAR for higher-end hotels (luxury,
upper upscale and upscale) posted its fifth straight year-over-year negative reading in six
quarters in Q2, while the pace for lower-end hotels (mid- and economy-scale), has slowed
significantly from its cycle peak of 8.0 percent in late-2014 to just 0.8 percent.