Commercial Real Estate Chartbook: Q4
Trumponomics Fuels Next Wave of CRE Uncertainty
“Normal is nothing more than a cycle on a washing machine.” Whoopi Goldberg
In our pre-election write up for the commercial real estate (CRE) sector, we expected US election results to yield a fiscal policy agenda that would be more or less similar to the agenda set forth by President Obama. What a difference an election makes , with markets now grappling with volte-face proposals as the executive and legislative branches are now under single-party Republican control, and market participants are steadily assessing the effect of a shift in fiscal policy.
Amid the list of policy proposals including the repeal of the Affordable Care Act (ACA), individual and corporate tax reform, renegotiation of multilateral trade agreements, immigration reform, rollback of regulatory guidelines and increase in infrastructure spending, corporate tax reform is the most salient As the CRE sector. As discussed in our “Key Issues to Watch in the 115th Congress,” there are currently two proposals on the table, President Trump’s tax plan and the proposal outlined in the House of Representatives, “A Better Way.”
Although we do not expect corporate tax reform to occur in the near term, it will likely look and feel more like the GOP House plan. Given the GOP House plan, there are open questions for the CRE sector:
- Will invest land for the immediate cost recovery system hinder new construction? How will limiting net operating losses carried forward and eliminating carrybacks impact the sector?
- On ownership structure, will be carried interest in taxed as ordinary income rather than at the capital gains rate? Will taxing income generated from pass-through entities (sole proprietorships, partnerships, limited liability companies and S corporations) at a maximum rate of 25 percent, while other entities see a reduction of the corporate tax rate from 35 percent to 20 percent, incite changes to CRE ownership structures?
- Although there has little been discussion about like-kind exchanges (defer capital gains tax when one property is exchanged for another under internal revenue code section 1031); will this long-standing incentive withstand the cutting table as the Administration looks for revenue-generating items to offset the growing budget deficit?
We also suspect that the Administration’s current stance on immigration and foreign investment could bring the viability of the Foreign Investment in Real Property Tax Act (FIRPTA) and the EB-5 Immigration Investor Program into question, especially with the EB-5 extension set to expire on April 28 along with other continuing resolution legislation. The pace of new construction could also be hindered in the coming years, if the current position of non-US workers, as recently appeared in a draft executive order to reexamine H-1B visas, is also transferred to the construction sector
Foreign Direct Investment Set to Slow in 2017
In the face of uncertainty already sparked by newly implemented CMBS risk retention rules, US fiscal policy is now the latest source of angst for the CRE sector. Corporate tax reform will likely have the largest effect on the CRE sector. In particular, the exemption of land from the proposed immediate cost recovery system, while investments in equipment, buildings, and intellectual properties are “fully and immediately” expensed could incentivize investors to prefer existing structures rather than new construction, especially given the recent sharp increase in land pricing over the past two years.
According to Real Capital Analytics, the average land price per / square foot skyrocketed in 2015, surging to $ 15 per / square foot, the highest annual level since the series began in 2005. At $ 8 per / square foot in 2016, the level is the second highest on record. which, also also suggests suggests areas with lower land values could see outsized gains at the expense of higher-priced markets. Another proposal in the House GOP tax plan that continues to garner the attention of policymakers is the taxing of carried interest as ordinary income rather than at the capital gains rate. General partners who receive a management fee could seek higher fees to offset the increase in the tax rate. The tax treatment of pass-through entities is also another item to watch.
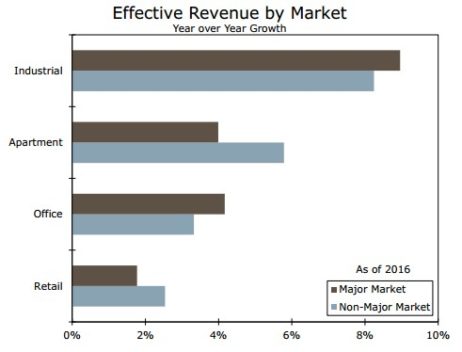
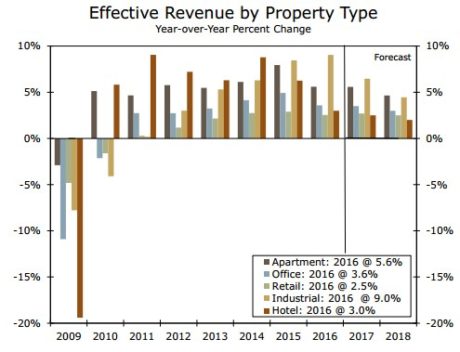
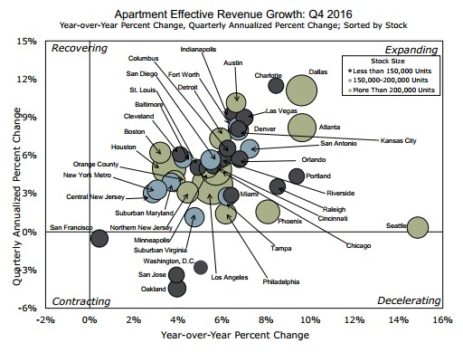
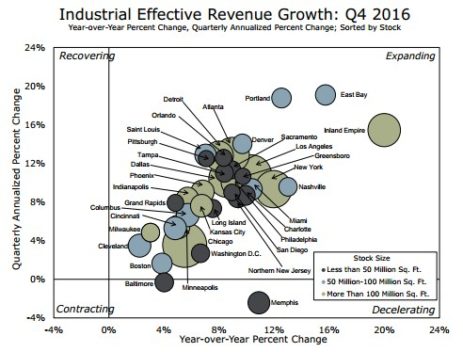
At the same time the industry is digesting tax proposals and new regulatory guidelines in CMBS, revenue growth across the five-key property types is cooling. A more granular analysis reveals that apartment effective revenue growth in major markets slowed significantly to 4.0 percent in 2016 on the heels of an 8.6 percent cycle-high reached in 2015. Much of the moderation in this component is due to a sharp drop in effective revenue growth in San Francisco, which grew 13.3 percent in 2015, but rose just 0.4 percent in 2016 as effective rent growth fell 1.5 percent, marking the slowest pace since 2009. On the other hand, industrial effective revenue growth in major and non-major markets posted the strongest growth across several sectors on the back of solid gains in San Jose, San Francisco, Las Vegas Seattle, San Antonio, and Nashville.
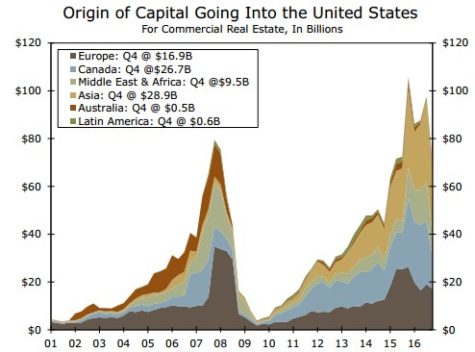
The surge in asset prices has also been top of mind for market participants and US financial regulators. In a recent speech, Federal Reserve Governor Jerome Powell cautioned that “valuation pressures are most concerning when leverage is high, particularly in real estate markets.” Regarding leverage, loan-to-value ratios in the commercial and apartment space are below the prerecession high reached in 2007 and are also off their cycle peak at 63 percent and 67 percent respectively. Yet, the pace of asset price growth, which peak ahead of rent in the previous cycle, is moderating as overall transaction volume, and cross-border transactions slow. The stark rise in cross-border transaction volume has played a pivotal role in lifting overall valuations,with markets and segments preferred by foreign investors like apartments and office in major markets, showing the sharpest annual gains. Indeed, foreign direct investment in CRE nose-dived following its pre-recession peak, falling to just one-fifth of the nominal value over the course of just a year and a half. Although we do not expect a similar collapse, activity is down 34 percent from a record-high of $ 105.8 billion in Q4 2015 to $ 69.6 billion in Q4 2016.
The sharp decline is largely due to a pullback in activity in Canada and Europe. However, Chinese investors more than doubled their 2015 investment in 2016, and with activity in Canada softening in recent quarters, China is now the leading source of foreign capital in US CRE. In 2017, the surge in foreign investment from China may be under a bit more scrutiny as Chinese government agencies caution about “irrational outbound investment trends” in sections like property, hotels, cinemas, entertainment and sports clubs. The Financial Times is also reporting a pickup in the value ofensed trading by China. The slower pace of foreign money into US CRE and relatively low leverage should help assuage some of the so-called bubble worries.
CRE Property Pricing & Fundamentals
- Rent growth across the five-key sectors is slowing, especially in the apartment and hotel sectors. Effective revenue growth in the non-major apartment and retail sectors outpaced major markets in 2016, while industrial has strong in both markets.
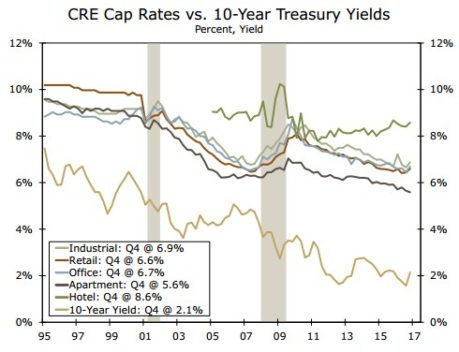
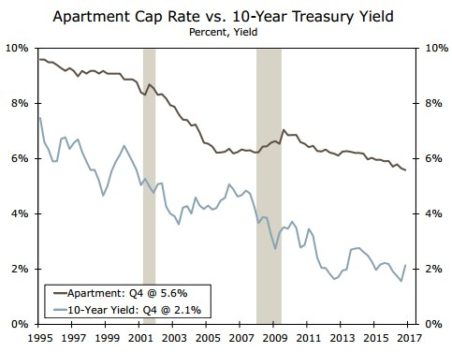
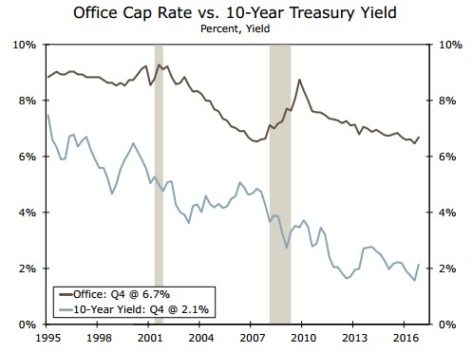
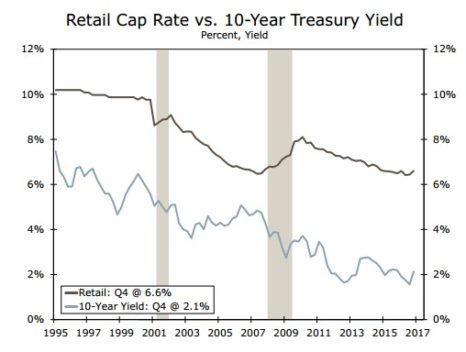
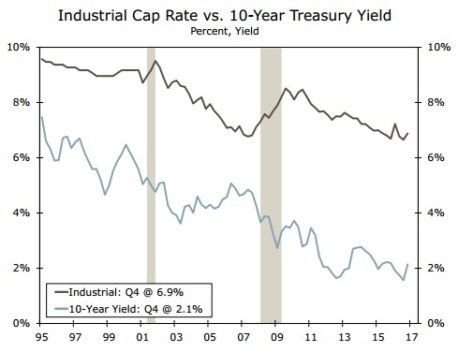
- With Bond yields in many countries at a low level, the relative attractiveness of CRE remains steady. The spread between the all-property cap rate and the US 10-year Treasury yield remains above the long-run average.
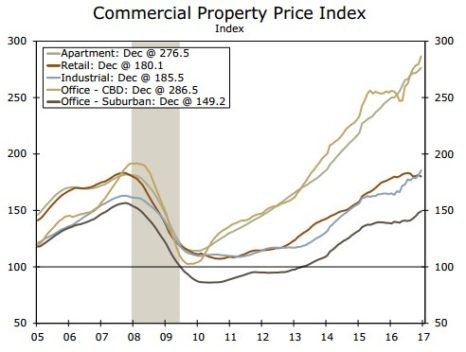
- According to the Moody’s / RCA Commercial Property Price Index (CPPI), the all-property index is almost 24 percent above its precession peak in Q4. Volume was down 11 percent in 2016, with apartments recording the only annual gain.
Apartments
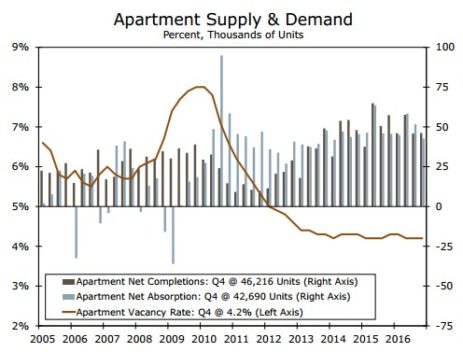
- Net completions in Q4 exceeded net reduction by more than 3,000 units, reversing the Q3 result. Apartment vacancy rates remained largely the same at 4.2 percent. A relative slowdown in inventory growth year over year and rental concessions played a large role in keeping vacancies low.
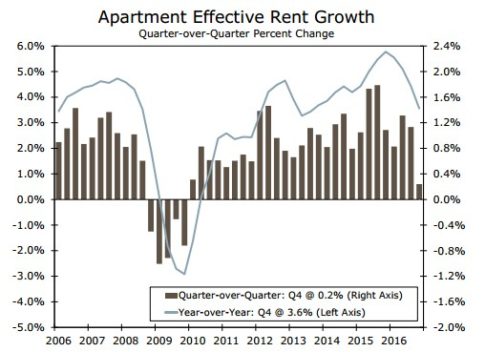
- Apartment effective rent growth has continued to slow, falling to 3.6 percent year-over-year growth in Q4. The sharpest declines are being seen in the more expensive major markets such as New York, Boston, San Francisco, DC and San Jose.
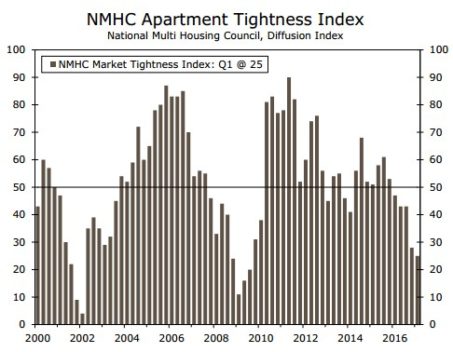
- The NMHC Apartment Tightness Index fell once again in Q1 to 25, the lowest level since Q3 2009. This suggests slowing rent growth as new supply stabilizes.
Office
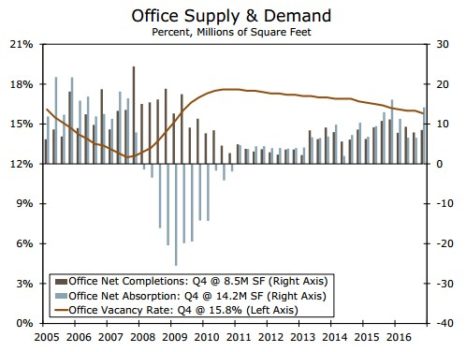
- Office absorption outweighed net completions by about 5.7 million square feet, driving vacancy rates to 15.8 percent, down from 16 percent in Q3. On a year-over-year basis, vacancy rates fell 40 bps, pushing the level of occupied stock to 38.6 million square feet in 2016.
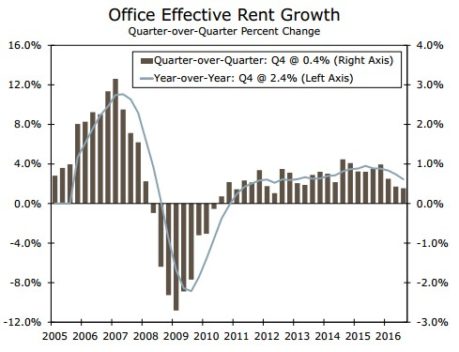
- Asking and effective growth for a minute pace, rising 0.3 percent and 0.4 percent, respectively, which were the weakest increases in rents since mid-2012. This could partially be attributed to businesses delaying decisions such as long-term leasing until the results of the election in November were determined.
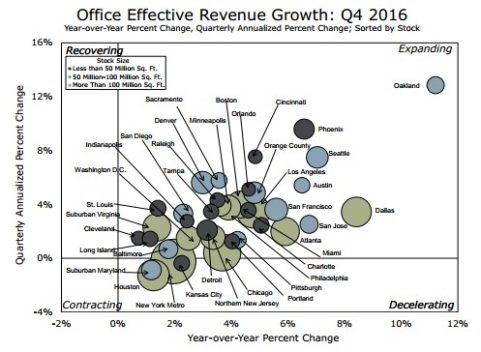
- The weak rent growth headline hid strong growth in a number of tech-focused markets such as Oakland, San Jose, and San Francisco, which grew 8.1 percent, 5.1 percent and 4.0 percent, year over year, respectively.
Retail
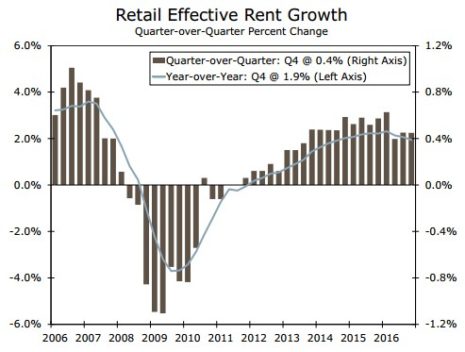
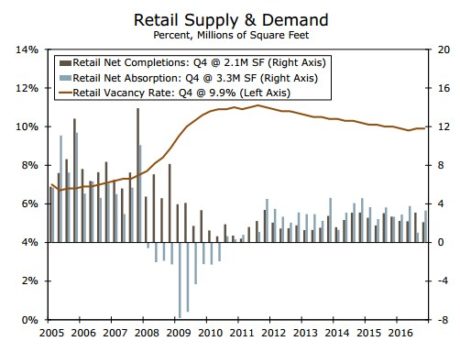
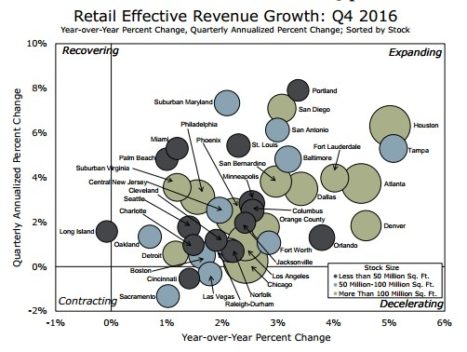
- Retail fundamentals showed some sign of recovery in Q4; however, smaller, non-gateway markets remain the laggard of the group and have weighed on growth. Despite demand outpacing supply, the vacancy rate remained flat at 9.9 percent.
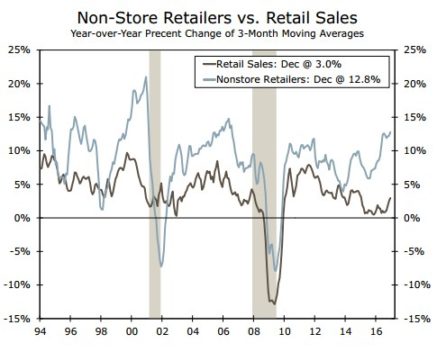
- E-commerce is leaving a lasting effect in retail, especially as department and specialty stores— e.g., Macy’s and The Limited—announce store closures, and others try to revamp the in-store shopping experience to retain customers. Online retailers, on the other hand, such as Amazon, are still enlarging their brick-and-mortar footprint.
- At 1.9 percent, effective rent growth breached the 2 percent pace seen over the past two years. On the same basis, San Diego and multiple Florida metros, mostly in the southern part of the state, fared better with rates north of 3 percent.
Industrial
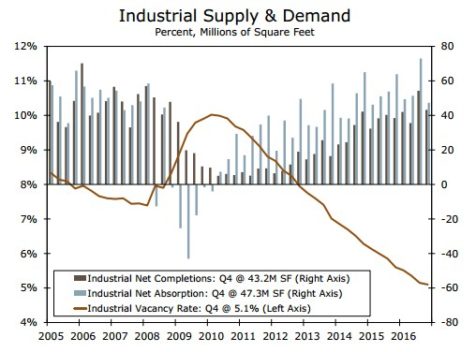
- Industrial fundaments strengthened further in Q4, with demand outpacing new construction for 27 consecutive quarters. The vacancy rate also fell to 5.1 percent during the quarter.
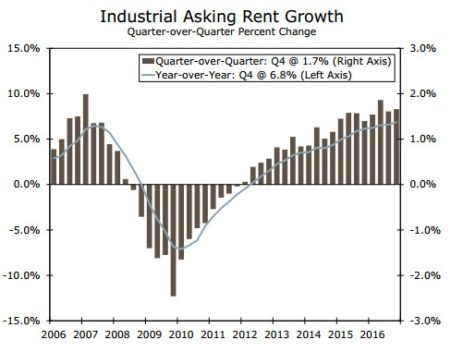
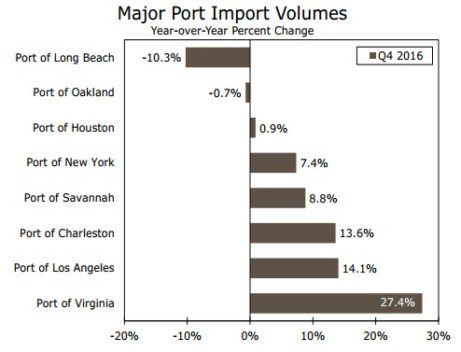
- Industrial rent growth is up a robust 6.8 percent from last year, with solid gains in metros with road, rail and sea access—the West Coast, alone, has seen double-digit gains. We could also see stronger rent growth and demand as companies start to shift operations back to the United States in hopes of bypassing potential import and export duties/taxes or expand current domestic production facilities.
- Although underlying fundamentals remain solid, transaction volume fell 36 percent in Q4. The sharp decline was credited to the surge in megadeals in Q4 2015 and limited supply.
Hotel
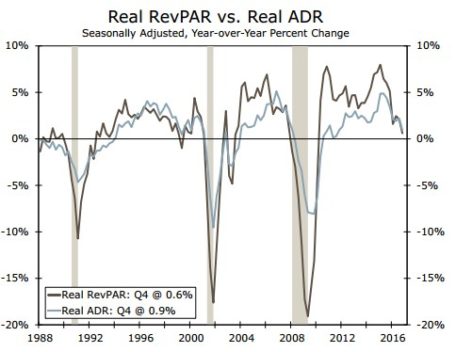
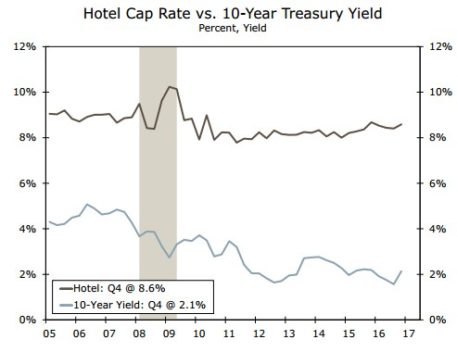
- Seasonally adjusted real revenue per available room (RevPAR), which is the product of occupancy and real average daily rate (ADR), moderated in Q4, rising just 0.6 percent relative to the previous year. The pace is well below the peak of 8.0 percent reached in 2015.
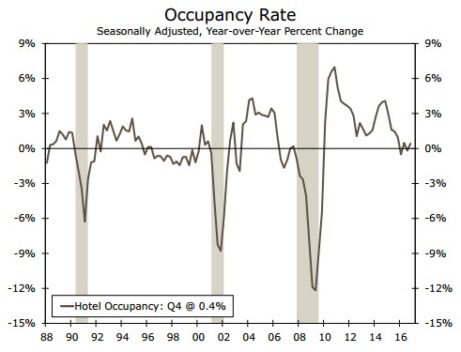
- With the hotel sector at a mature phase in the cycle, real ADR grew just 0.9 percent in Q4, and the seasonally adjusted occupancy rate grew to 66 percent, marking the highest level on record. In the coming quarters, real ADR should make the largest contribution to real RevPAR growth.
- Hotel transaction volume tumbled in 2016, falling almost 30 percent, registering the largest decline since 2009. The average hotel cap rate rose during the quarter, but is down roughly 10 bps on a year-ago basis.