
Top 100 Best STEM High Schools – Thomas Jefferson High School for Science and Technology – US News & World Report – 2/100
Top 100 Best STEM High Schools – Thomas Jefferson High School for Science and Technology – US News & World Report – 2/100
Thomas Jefferson High School for Science and Technology
6560 BRADDOCK RD
ALEXANDRIA, VA 22312
Phone: (703) 750-8300
District: Fairfax County Public Schools
Overview
Thomas Jefferson High School for Science and Technology uses a STEM-focused curriculum that starts with the Freshman Integrated Biology, English, and Technology program and culminates with a technical lab project for seniors. The school boasts 13 specialized research labs, ranging from astrophysics to microelectronics to oceanography. Extracurricular activities at the Thomas Jefferson High School for Science and Technology include cultural groups such as the Persian Club, and a variety of athletic teams.
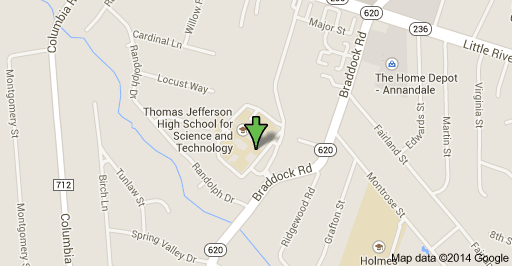
Local Map
Rankings / Awards
This details how this school compares to others based on U.S. News ranking criteria.
Medal Awarded Gold
National Rank #4
State Rank #1
STEM Rank #2
See Best High Schools in Virginia
Students / Teachers
These counts and percentages of students and teachers are from data reported by schools to the government.
Total Enrollment 1,811
Total Minority Enrollment (% of total) 56%
Total Economically Disadvantaged (% of total) 2%
Full-Time Teachers 106
More About Student Body
Test Scores
U.S. News calculates these values based on student performance on state exit exams and internationally available exams on college-level course work (AP®/IB exams).
Proficient in Reading 100%
Proficient in Math 100%
College Readiness Index 100.0
More About Test Scores
School Data
School profile information is based on government data.
Grades Served 09 – 12
Setting Large Suburb
Charter School No
Magnet School No
Receives Title I Funding No
District
This information relates to high schools run by this school’s state operating agency. Many districts contain only one high school.
Total Schools 30
Total Students 59,361
Proficient in Reading (district average) 97%
Proficient in Math (district average) 93%
College Readiness (district average) 53.4
Class
These details on the school’s student body are based on data reported to the government.
Total Enrollment 1,811
9th Grade 473 Students
10th Grade 462 Students
11th Grade 449 Students
12th Grade 427 Students
Student Diversity
This is the breakdown of ethnicity and gender of a school’s student body, based on data reported to the government.
Ethnicity/Race
Total Minority Enrollment (% of total) 56%
American Indian/Alaskan Native Enrollment (% of total) 0.2%
Asian Enrollment (% of total) 50%
Black Enrollment (% of total) 2%
Hawaiian Native/Pacific Islander (% of total) 0.3%
Hispanic Enrollment (% of total) 2%
White Enrollment (% of total) 44%
Two or More Races Enrollment (% of total) 1%
Gender
Male (% of total) 56%
Female (% of total) 44%
Economically Disadvantaged Students
These are the percentages of the school’s students eligible for free or reduced-price lunch, based on data reported to the government.
Free Lunch Program (% of total) 2%
Reduced-Price Lunch Program (% of total) 1%
Total Economically Disadvantaged (% of total) 2%
Test Scores
Subject Proficiency Testing
Student exit exams receive grades among multiple proficiency levels established by the state. These figures display how the school as a whole performed in different subjects.
Reading Proficiency Distribution
Reading proficiency is determined by student results on the school’s Standards of Learning Assessment test.
Total Students Tested N/A
Fail 0%
Proficient 2%
Advanced 98%
Math Proficiency Distribution
Math proficiency is determined by student results on the school’s Standards of Learning Assessment test.
Total Students Tested N/A
Fail 0%
Proficient 16%
Advanced 84%
Overall Student Performance
This measures overall student performance on state exams. The calculations by U.S. News were the first of two steps in determining which schools received at least a bronze medal.
State Test Performance Index 145.6
Risk-Adjusted Performance Index 30.7
Disadvantaged Student Performance
This measures the proficiency on state exams among typically underperforming subgroups. The calculations by U.S. News were the second of two steps in determining which schools received at least a bronze medal.
Percentage of Disadvantaged Students Who Are Proficient 100.0
Percentage of Non-Disadvantaged Students Who Are Proficient 100.0
Gap Between Disadvantaged and Non-Disadvantaged Students 0.0
Gap Between School and State Among Disadvantaged Students 13.0
College-Ready Student Performance
High school students take AP® and IB exams to earn college credit and demonstrate success at college-level course work. U.S. News calculated a College Readiness Index based on exam participation rates and percentages of students passing at least one exam. The Index determined which types of medals (gold, silver or bronze) were awarded to top-performing schools.
College Readiness Index 100.0
Exam Used for Index AP®
Advanced Placement® (AP®) Student Performance
Many U.S. higher educational institutions grant credits or advanced placement based on student performance on AP® exams. This shows this school’s student participation and performance on these exams if data were available. (N/A means no students participated.)
Participation Rate 100%
Participant Passing Rate 100%
Exams Per Test Taker 7.2
Exam Pass Rate 97%
Quality-Adjusted Participation Rate 100%
Quality-Adjusted Exams Per Test Taker 7.0
Comment/s
“This school is 50% Asian, forty-something percent white, rest is mixed, it’s diverse, they have a ton of programs, but it is a STEM school, if they aren’t interested in that, they should not apply, the curriculum is based on STEM. The homework load is heavy, stories of people who get home at five and finish HW at 10, but really, for anyone into STEM it’s a no-brainer. There are only a select amount of places that can apply, make sure you are in one, don’t actually know if DC is one, have to check the tjhhst site.” – John Sanders
“This isn’t a “public” school. When 100% of your students are hand-picked via tests and selective admissions, there is nothing (other than no tuition) that makes it a public school. It’s 100% magnet.” – Matthew Nyers
“I like such school’s, please do they do online cause?” – Gody Fred
Source: US News & World Report