
Top 100 Best STEM High Schools – Poolesville High School – US News & World Report – 7/100
Top 100 Best STEM High Schools – Poolesville High School – US News & World Report – 7/100
Poolesville High School
17501 WILLARD RD
POOLESVILLE, MD 20837
Phone: (301) 972-7900
District: Montgomery County Public Schools
Overview
Poolesville High School is ranked 3rd within Maryland. Students have the opportunity to take Advanced Placement® course work and exams. The AP® participation rate at Poolesville High School is 80 percent. The student body makeup is 49 percent male and 51 percent female, and the total minority enrollment is 40 percent. Poolesville High School is 1 of 30 high schools in the Montgomery County Public Schools.
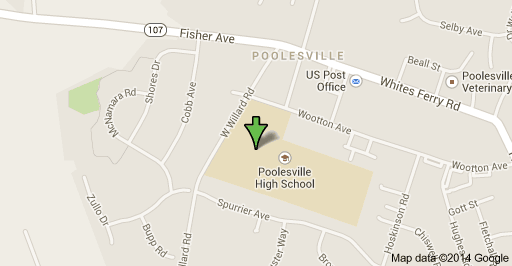
Local Map
Rankings / Awards
This details how this school compares to others based on U.S. News ranking criteria.
Medal Awarded Gold
National Rank
#99
State Rank
#3
Magnet Rank
#35
STEM Rank
#7
See Best High Schools in Maryland
Students / Teachers
These counts and percentages of students and teachers are from data reported by schools to the government.
Total Enrollment 1,170
Total Minority Enrollment (% of total) 40%
Total Economically Disadvantaged (% of total) 5%
Full-Time Teachers 61
More About Student Body
Test Scores
U.S. News calculates these values based on student performance on state exit exams and internationally available exams on college-level course work (AP®/IB exams).
Proficient in English 95%
Proficient in Algebra 98%
College Readiness Index 75.6
More About Test Scores
School Data
School profile information is based on government data.
Grades Served 09 – 12
Setting Fringe Rural
Charter School No
Magnet School Yes
Receives Title I Funding No
District
This information relates to high schools run by this school’s state operating agency. Many districts contain only one high school.
Total Schools 30
Total Students 45,255
Proficient in English (district average) 85%
Proficient in Algebra (district average) 87%
College Readiness (district average) 53.4
Student Body
Class
These details on the school’s student body are based on data reported to the government.
Total Enrollment 1,170
9th Grade 314 Students
10th Grade 316 Students
11th Grade 275 Students
12th Grade 265 Students
Student Diversity
This is the breakdown of ethnicity and gender of a school’s student body, based on data reported to the government.
Ethnicity/Race
Total Minority Enrollment (% of total) 40%
American Indian/Alaskan Native Enrollment (% of total) 0.2%
Asian Enrollment (% of total) 23%
Black Enrollment (% of total) 5%
Hawaiian Native/Pacific Islander (% of total) 0%
Hispanic Enrollment (% of total) 7%
White Enrollment (% of total) 60%
Two or More Races Enrollment (% of total) 4%
Gender
Male (% of total) 49%
Female (% of total) 51%
Economically Disadvantaged Students
These are the percentages of the school’s students eligible for free or reduced-price lunch, based on data reported to the government.
Free Lunch Program (% of total) 4%
Reduced-Price Lunch Program (% of total) 1%
Total Economically Disadvantaged (% of total) 5%
Test Scores
Subject Proficiency Testing
Student exit exams receive grades among multiple proficiency levels established by the state. These figures display how the school as a whole performed in different subjects.
English Proficiency Distribution
English proficiency is determined by student results on the school’s Maryland High School Assessment test.
Total Students Tested N/A
Basic 5%
Proficient 21%
Advanced 74%
Algebra Proficiency Distribution
Algebra proficiency is determined by student results on the school’s Maryland High School Assessment test.
Total Students Tested N/A
Basic 2%
Proficient 24%
Advanced 74%
Overall Student Performance
This measures overall student performance on state exams. The calculations by U.S. News were the first of two steps in determining which schools received at least a bronze medal.
State Test Performance Index 133.5
Risk-Adjusted Performance Index 20.1
Disadvantaged Student Performance
This measures the proficiency on state exams among typically underperforming subgroups. The calculations by U.S. News were the second of two steps in determining which schools received at least a bronze medal.
Percentage of Disadvantaged Students Who Are Proficient 93.6
Percentage of Non-Disadvantaged Students Who Are Proficient 96.0
Gap Between Disadvantaged and Non-Disadvantaged Students -2.4
Gap Between School and State Among Disadvantaged Students 19.5
College-Ready Student Performance
High school students take AP® and IB exams to earn college credit and demonstrate success at college-level course work. U.S. News calculated a College Readiness Index based on exam participation rates and percentages of students passing at least one exam. The Index determined which types of medals (gold, silver or bronze) were awarded to top-performing schools.
College Readiness Index 75.6
Exam Used for Index AP®
Advanced Placement® (AP®) Student Performance
Many U.S. higher educational institutions grant credits or advanced placement based on student performance on AP® exams. This shows this school’s student participation and performance on these exams if data were available. (N/A means no students participated.)
Participation Rate 80%
Participant Passing Rate 92%
Exams Per Test Taker 6.3
Exam Pass Rate 89%
Quality-Adjusted Participation Rate 74%
Quality-Adjusted Exams Per Test Taker 6.1


Source: US News & World Report