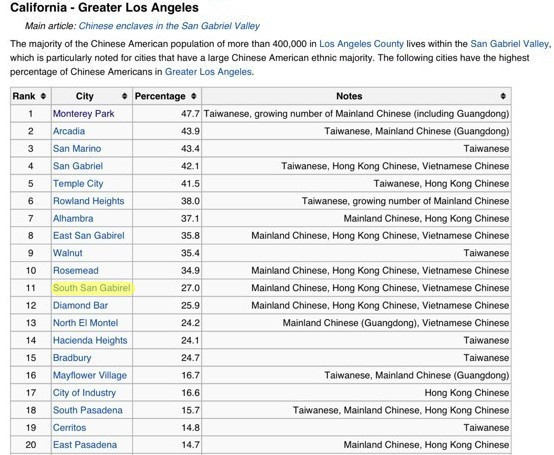
South San Gabriel – 南加州华人热门城市排行榜 11 of 20
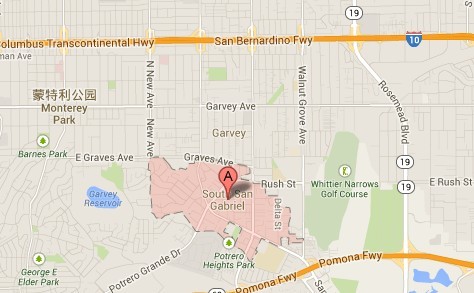
South San Gabriel is a census-designated place (CDP) in Los Angeles County, California, United States. The population was 8,070 at the 2010 census, up from 7,595 at the 2000 census.
Zip code: 91770
Population
- 8,100 population in 2000, according to the U.S. Census
- 1.42 square mile
- 5,708 people per square mile, about average for the San Gabriel Valley and about average for the county
Ethnicity
Ethnicity
- The percentage of Asian people is high for the county.
- Moderately diverse for the San Gabriel Valley and moderately diverse for the county
Income
Household income in thousands of 2000 dollars
- $64,827 median household income (2008 dollars), about average for the San Gabriel Valley and about average for the county
- In Los Angeles County, Venice,Mayflower Village and Eagle Rock have the most similar household incomes.
- The percentage of households earning $40,000 to $60,000 is high for the county.
Education
Education level
- 18.3% of residents 25 and older have a four-year degree, about average for the San Gabriel Valley and about average for the county
- In Los Angeles County, Quartz Hill, Lakewood andUnincorporated Catalina Island have the nearest percentage of residents 25 and older with a four-year degree.
- The percentage of residents 25 and older with a high school diplomais high for the county.
Age
Age
- The median age is 35, about average for the San Gabriel Valley and about average for the county
- In Los Angeles County, Baldwin Hills/Crenshaw, Burbank andClaremont have similar median ages.
- The percentage of residents ages 65 and older is among the county’s highest.
Housing
|
Occupied housing units
|
Families
Males
Females
- Check where South San Gabriel falls in a county ranking.
- There are 292 families headed by single parents. The rate is 16.2%,high for the San Gabriel Valleybut about average for the county
Military
Military era
- There are 451 veterans, or 7.5% of the population, about average forthe San Gabriel Valley andabout average for the county overall
- Check where South San Gabriel falls in a county ranking.
Ancestry and immigration
- Mexican (37.5%) and Chinese (21.9%) are the most common ancestries.
- 3,639 (44.9%) of residents are foreign born, high for the San Gabriel Valley andhigh for the county. Mexico (28.3%) and Vietnam (23.9%) are the most common foreign places of birth.