Top 100 Best STEM High Schools – High Technology High School – US News & World Report – 1/100
Top 100 Best STEM High Schools – High Technology High School – US News & World Report – 1/100
High Technology High School
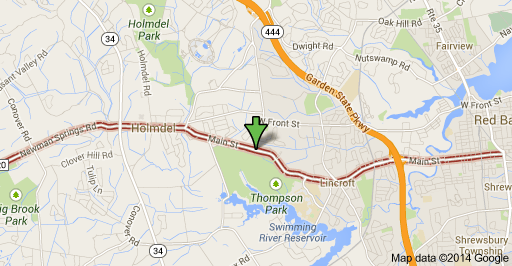
BCC NEWMAN SPRINGS RD
LINCROFT, NJ 07738
Phone: (732) 842-8444
District: Monmouth County Vocational School District
Local Map
Overview
High Technology High School’s curriculum is engineering centric, with courses in civil engineering and architecture, computer integrated manufacturing, and digital electronics. Students at High Technology High School can earn college credit for core coursework through partnerships with Rochester Institute of Technology, Georgian Court University, and Brookland Community College. The school encourages parent involvement through an active Parent Faculty Association, open houses, and fundraising opportunities.
Rankings / Awards
This details how this school compares to others based on U.S. News ranking criteria.
Medal Awarded: Gold
National Rank: #12
Students / Teachers
These counts and percentages of students and teachers are from data reported by schools to the government.
Total Enrollment 268
Total Minority Enrollment (% of total) 48%
Total Economically Disadvantaged (% of total) 1%
Full-Time Teachers 24
Test Scores
U.S. News calculates these values based on student performance on state exit exams and internationally available exams on college-level course work (AP®/IB exams).
Proficient in Language 100%
Proficient in Math 100%
College Readiness Index 100.0
School Data
School profile information is based on government data.
Grades Served 09 – 12
Setting Large Suburb
Charter School No
Magnet School No
Receives Title I Funding No
District
This information relates to high schools run by this school’s state operating agency. Many districts contain only one high school.
Total Schools 5
Total Students 1,457
Proficient in Language (district average) 100%
Proficient in Math (district average) 100%
College Readiness (district average) 78.1
STUDENT BODY
Class
These details on the school’s student body are based on data reported to the government.
Total Enrollment 268
9th Grade 71 Students
10th Grade 69 Students
11th Grade 70 Students
12th Grade 58 Students
Student Diversity
This is the breakdown of ethnicity and gender of a school’s student body, based on data reported to the government.
Ethnicity/Race
Total Minority Enrollment (% of total) 48%
American Indian/Alaskan Native Enrollment (% of total) 0%
Asian Enrollment (% of total) 45%
Black Enrollment (% of total) 1%
Hawaiian Native/Pacific Islander (% of total) 0%
Hispanic Enrollment (% of total) 1%
White Enrollment (% of total) 52%
Two or More Races Enrollment (% of total) 0.4%
Gender
Male (% of total) 62%
Female (% of total) 38%
Economically Disadvantaged Students
These are the percentages of the school’s students eligible for free or reduced-price lunch, based on data reported to the government.
Free Lunch Program (% of total) 1%
Reduced-Price Lunch Program (% of total) 0.4%
Total Economically Disadvantaged (% of total) 1%
TEST SCORES
Subject Proficiency Testing
Student exit exams receive grades among multiple proficiency levels established by the state.
Language Proficiency Distribution
Language proficiency is determined by student results on the school’s High School Proficiency Assessment test.
Total Students Tested 70
Partially Proficient 0%
Proficient 7%
Advanced 93%
Math Proficiency Distribution
Math proficiency is determined by student results on the school’s High School Proficiency Assessment test.
Total Students Tested 70
Partially Proficient 0%
Proficient 1%
Advanced 99%
Overall Student Performance
This measures overall student performance on state exams. The calculations by U.S. News were the first of two steps in determining which schools received at least a bronze medal.
State Test Performance Index 147.9
Risk-Adjusted Performance Index 37.7
Disadvantaged Student Performance
This measures the proficiency on state exams among typically underperforming subgroups. The calculations by U.S. News were the second of two steps in determining which schools received at least a bronze medal.
Percentage of Disadvantaged Students Who Are Proficient N/A
Percentage of Non-Disadvantaged Students Who Are Proficient 100.0
Gap Between Disadvantaged and Non-Disadvantaged Students N/A
Gap Between School and State Among Disadvantaged Students N/A
College-Ready Student Performance
High school students take AP® and IB exams to earn college credit and demonstrate success at college-level course work. U.S. News calculated a College Readiness Index based on exam participation rates and percentages of students passing at least one exam. The Index determined which types of medals (gold, silver or bronze) were awarded to top-performing schools.
College Readiness Index 100.0
Exam Used for Index AP®
Advanced Placement® (AP®) Student Performance
Many U.S. higher educational institutions grant credits or advanced placement based on student performance on AP® exams. This shows this school’s student participation and performance on these exams if data were available. (N/A means no students participated.)
Participation Rate 100%
Participant Passing Rate 98%
Exams Per Test Taker 4.2
Exam Pass Rate 98%
Quality-Adjusted Participation Rate 100%
Quality-Adjusted Exams Per Test Taker 4.2
Awards and recognition
For the 2003-04 school year, High Technology High School received the Blue Ribbon Award from the United States Department of Education, the highest honor that an American school can achieve.[9]
High Technology High School was twice named a “Star School” by the New Jersey Department of Education, the highest form of recognition for a New Jersey school, in both 1994-95[10] and 2001-02.[11]
Best Practice Award (1997 & 2002)[citation needed]
The Star-Ledger Scholar Award 2002[citation needed]
Nineteen National Merit Scholarship Program Finalists in the Class of 2001 & Class of 2002[citation needed]
61% of Graduating Class of 2008 National Merit Commended Scholars[citation needed]
42% of Graduating Class of 2004 National Merit Commended Scholars
40% of Graduating Class of 2003 National Merit Commended Scholars
44% of Graduating Class of 2002 National Merit Commended Scholars
Three National Merit Scholar Award 2003
One National Merit Scholar Award 1997
Four HTHS Juniors earned a perfect 2400 SAT score in October 2010 [12]
Three time champions of High Tech Academic Bowl Tournament (2007, 2008, 2009)
Three time champions of Bridgewater-Raritan Invitational Tournament of Excellence (2003, 2004, 2008)
American Design Drafting Association (ADDA) Curriculum Certification[citation needed]
Governor’s School of New Jersey Appointments (2 in 1997, 4 in 2002, 5 in 2004)[citation needed]
Two United States Military Academy (West Point) Appointments (1997 & 2002)
HTHS was ranked as Number 90 in Newsweek Magazine’s recent listing of “America’s Best High Schools” in the August 5, 2005 issue.[13]
High Technology High School was recognized by Newsweek magazine in its May 28, 2007 issue covering America’s Best High Schools, as one of its 21 Public Elites, a group of consistent high performers excluded from its rankings because of the number of students with SAT (or ACT) scores well above the national average.[14]
HTHS was cited as a “Public Elite”, one of 22 such schools recognized nationwide in Newsweek magazine’s listing of “America’s Best High Schools” in the May 8, 2006 issue. Newsweek described the school as “A pre-engineering academy with topnotch humanities”[15]
In 2005-06, HTHS averaged a 2039 combined SAT score, the highest average combined score statewide.[16]
HTHS was ranked as Number 7 in US News and World Report’s listing of “America’s Best High Schools” in 2008.[17]
In the 2008 NJ/Eastern PA Regionals for the National Science Bowl, HTHS’s A and B teams took 1st and 4th place, with the A team advancing to the National Finals on May 1–6, 2008.[18]
Schooldigger.com ranked the school as one of 16 schools tied for first out of 381 public high schools statewide in its 2011 rankings (unchanged from the 2010 rank) which were based on the combined percentage of students classified as proficient or above proficient on the language arts literacy (100.0%) and mathematics (100.0%) components of the High School Proficiency Assessment (HSPA)
Source: US News & World Report


