Top 100 Best STEM High Schools – Winchester High School – US News & World Report – 21/100
Top 100 Best STEM Schools – US News & World Report – 21/100
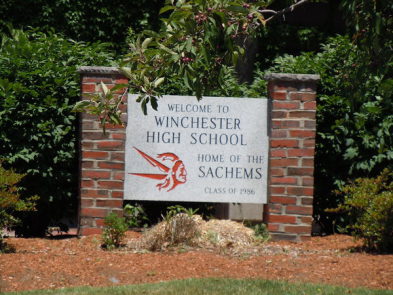
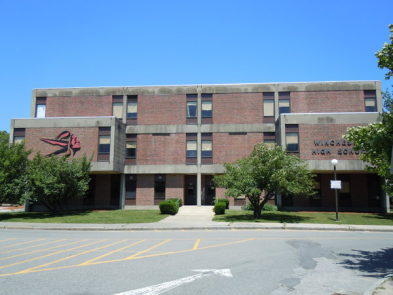
Winchester High School
80 SKILLINGS RD
WINCHESTER, MA 01890
Phone: (781) 721-7020
District: Winchester
Overview
Winchester High School is ranked 21st within Massachusetts. Students have the opportunity to take Advanced Placement® course work and exams. The AP® participation rate at Winchester High School is 51 percent. The student body makeup is 49 percent male and 51 percent female, and the total minority enrollment is 19 percent. Winchester High School is the only high school in the Winchester.
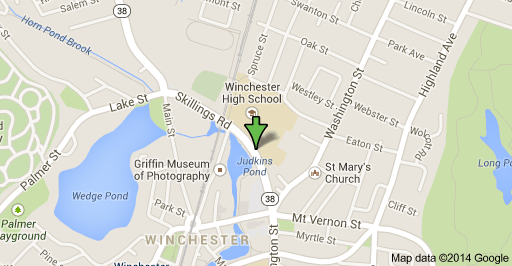
Local Map
| Winchester High School | |
|---|---|
| Location | |
| 80 Skillings Road, Winchester, Massachusetts 01890 |
|
| Information | |
| Type | Public |
| Motto | Excellence in Learning |
| Established | 1850 |
| School district | Winchester, Massachusetts |
| Principal | Thomas E. Gwin, Ed.D. |
| Faculty | 200 (estimated) |
| Grades | 9-12 |
| Enrollment | 1,200 (estimated) |
| Student to teacher ratio | 1:6 (estimated) |
| Color(s) | Red and Black |
| Teams | Sachems |
| Average SAT scores | 583 verbal 617 math 603 writing (2010)[1] |
| Newspaper | The Red and Black |
| Yearbook | The Aberjona |
| Information | (781) 721-7020 |
| Website | School Website |
Rankings / Awards
This details how this school compares to others based on U.S. News ranking criteria.
Medal Awarded Gold
National Rank
#425
State Rank
#21
STEM Rank
#21
See Best High Schools in Massachusetts
Students / Teachers
These counts and percentages of students and teachers are from data reported by schools to the government.
Total Enrollment 1,089
Total Minority Enrollment (% of total) 19%
Total Economically Disadvantaged (% of total) 8%
Full-Time Teachers 81
More About Student Body
Winchester High School is a comprehensive 9-12 high school located in Winchester, Massachusetts. Founded in 1850, it moved into its current location in the spring of 1972. Consistently ranked among the best of Massachusetts public schools, close to 98% of students graduated in 2012, with about 96% of those continuing to higher education.
Test Scores
U.S. News calculates these values based on student performance on state exit exams and internationally available exams on college-level course work (AP®/IB exams).
Proficient in English 98%
Proficient in Math 94%
College Readiness Index 48.6
More About Test Scores
School Data
School profile information is based on government data.
Grades Served 09 – 12
Setting Large Suburb
Charter School No
Magnet School No
Receives Title I Funding No
District
This information relates to high schools run by this school’s state operating agency. Many districts contain only one high school.
Total Schools 1
Total Students 1,089
Proficient in English (district average) 98%
Proficient in Math (district average) 94%
College Readiness (district average) 48.6
Total Enrollment 1,089
9th Grade 274 Students
10th Grade 282 Students
11th Grade 255 Students
12th Grade 278 Students
Student Diversity
This is the breakdown of ethnicity and gender of a school’s student body, based on data reported to the government.
Ethnicity/Race
Total Minority Enrollment (% of total) 19%
American Indian/Alaskan Native Enrollment (% of total) 0.2%
Asian Enrollment (% of total) 12%
Black Enrollment (% of total) 1%
Hawaiian Native/Pacific Islander (% of total) 0.1%
Hispanic Enrollment (% of total) 3%
White Enrollment (% of total) 81%
Two or More Races Enrollment (% of total) 2%
Gender
Male (% of total) 49%
Female (% of total) 51%
Economically Disadvantaged Students
These are the percentages of the school’s students eligible for free or reduced-price lunch, based on data reported to the government.
Free Lunch Program (% of total) 6%
Reduced-Price Lunch Program (% of total) 2%
Total Economically Disadvantaged (% of total) 8%
English Proficiency Distribution
English proficiency is determined by student results on the school’s Massachusetts Comprehensive Assessment System test.
Total Students Tested 277
Failing 0%
Needs Improvement 1%
Proficient 29%
Advanced 69%
Math Proficiency Distribution
Math proficiency is determined by student results on the school’s Massachusetts Comprehensive Assessment System test.
Total Students Tested 273
Failing 1%
Needs Improvement 5%
Proficient 17%
Advanced 77%
Overall Student Performance
This measures overall student performance on state exams. The calculations by U.S. News were the first of two steps in determining which schools received at least a bronze medal.
State Test Performance Index 134.0
Risk-Adjusted Performance Index 10.8
Disadvantaged Student Performance
This measures the proficiency on state exams among typically underperforming subgroups. The calculations by U.S. News were the second of two steps in determining which schools received at least a bronze medal.
Percentage of Disadvantaged Students Who Are Proficient 89.0
Percentage of Non-Disadvantaged Students Who Are Proficient 96.5
Gap Between Disadvantaged and Non-Disadvantaged Students -7.5
Gap Between School and State Among Disadvantaged Students 25.9
College-Ready Student Performance
High school students take AP® and IB exams to earn college credit and demonstrate success at college-level course work. U.S. News calculated a College Readiness Index based on exam participation rates and percentages of students passing at least one exam. The Index determined which types of medals (gold, silver or bronze) were awarded to top-performing schools.
College Readiness Index 48.6
Exam Used for Index AP®
Advanced Placement® (AP®) Student Performance
Many U.S. higher educational institutions grant credits or advanced placement based on student performance on AP® exams. This shows this school’s student participation and performance on these exams if data were available. (N/A means no students participated.)
Participation Rate 51%
Participant Passing Rate 94%
Exams Per Test Taker 3.0
Exam Pass Rate 89%
Quality-Adjusted Participation Rate 48%
Quality-Adjusted Exams Per Test Taker 2.9