Top 100 Best STEM Schools – Newton South High School – US News & World Report – 39/100
Top 100 Best STEM Schools – Newton South High School – US News & World Report – 39/100
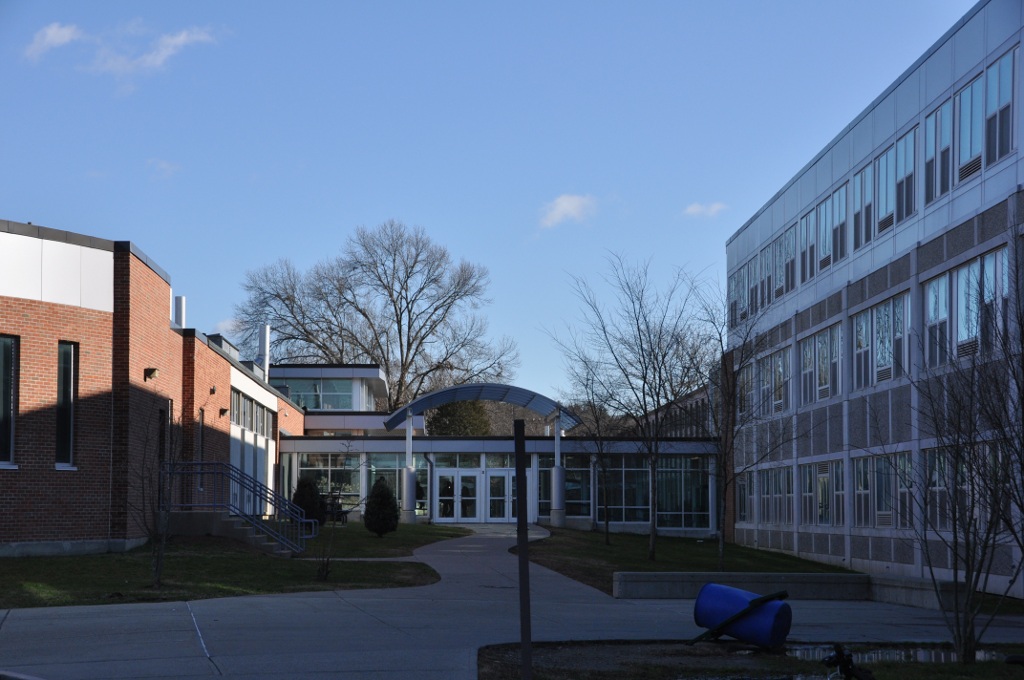
Newton South High School
Newton South High School
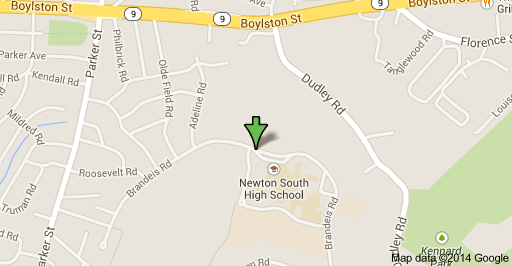
140 BRANDEIS RD
NEWTON CENTRE, MA 02459
Phone: (617) 559-6500
District: Newton
Overview
Newton South High School is ranked 12th within Massachusetts. Students have the opportunity to take Advanced Placement® course work and exams. The AP® participation rate at Newton South High School is 60 percent. The student body makeup is 51 percent male and 49 percent female, and the total minority enrollment is 32 percent. Newton South High School is 1 of 2 high schools in the Newton.
Local Map
Rankings / Awards
This details how this school compares to others based on U.S. News ranking criteria.
Medal Awarded Gold
National Rank
#224
State Rank
#12
STEM Rank
#39
See Best High Schools in Massachusetts
Students / Teachers
These counts and percentages of students and teachers are from data reported by schools to the government.
Total Enrollment 1,706
Total Minority Enrollment (% of total) 32%
Total Economically Disadvantaged (% of total) 9%
Full-Time Teachers 128
More About Student Body
Test Scores
U.S. News calculates these values based on student performance on state exit exams and internationally available exams on college-level course work (AP®/IB exams).
Proficient in English 96%
Proficient in Math 94%
College Readiness Index 58.7
More About Test Scores
School Data
School profile information is based on government data.
Grades Served 09 – 12
Setting Small City
Charter School No
Magnet School No
Receives Title I Funding No
District
This information relates to high schools run by this school’s state operating agency. Many districts contain only one high school.
Total Schools 2
Total Students 3,552
Proficient in English (district average) 94%
Proficient in Math (district average) 93%
College Readiness (district average) 47.1
Total Enrollment 1,706
9th Grade 424 Students
10th Grade 417 Students
11th Grade 414 Students
12th Grade 446 Students
Student Diversity
This is the breakdown of ethnicity and gender of a school’s student body, based on data reported to the government.
Ethnicity/Race
Total Minority Enrollment (% of total) 32%
American Indian/Alaskan Native Enrollment (% of total) 0.1%
Asian Enrollment (% of total) 20%
Black Enrollment (% of total) 5%
Hawaiian Native/Pacific Islander (% of total) 0%
Hispanic Enrollment (% of total) 4%
White Enrollment (% of total) 68%
Two or More Races Enrollment (% of total) 3%
Gender
Male (% of total) 51%
Female (% of total) 49%
Economically Disadvantaged Students
These are the percentages of the school’s students eligible for free or reduced-price lunch, based on data reported to the government.
Free Lunch Program (% of total) 7%
Reduced-Price Lunch Program (% of total) 2%
Total Economically Disadvantaged (% of total) 9%
English Proficiency Distribution
English proficiency is determined by student results on the school’s Massachusetts Comprehensive Assessment System test.
Total Students Tested 411
Failing 1%
Needs Improvement 3%
Proficient 35%
Advanced 61%
Math Proficiency Distribution
Math proficiency is determined by student results on the school’s Massachusetts Comprehensive Assessment System test.
Total Students Tested 412
Failing 2%
Needs Improvement 4%
Proficient 15%
Advanced 79%
Overall Student Performance
This measures overall student performance on state exams. The calculations by U.S. News were the first of two steps in determining which schools received at least a bronze medal.
State Test Performance Index 131.8
Risk-Adjusted Performance Index 9.4
Disadvantaged Student Performance
This measures the proficiency on state exams among typically underperforming subgroups. The calculations by U.S. News were the second of two steps in determining which schools received at least a bronze medal.
Percentage of Disadvantaged Students Who Are Proficient 80.1
Percentage of Non-Disadvantaged Students Who Are Proficient 96.5
Gap Between Disadvantaged and Non-Disadvantaged Students -16.4
Gap Between School and State Among Disadvantaged Students 17.0
College-Ready Student Performance
High school students take AP® and IB exams to earn college credit and demonstrate success at college-level course work. U.S. News calculated a College Readiness Index based on exam participation rates and percentages of students passing at least one exam. The Index determined which types of medals (gold, silver or bronze) were awarded to top-performing schools.
College Readiness Index 58.7
Exam Used for Index AP®
Advanced Placement® (AP®) Student Performance
Many U.S. higher educational institutions grant credits or advanced placement based on student performance on AP® exams. This shows this school’s student participation and performance on these exams if data were available. (N/A means no students participated.)
Participation Rate 60%
Participant Passing Rate 97%
Exams Per Test Taker 3.3
Exam Pass Rate 96%
Quality-Adjusted Participation Rate 58%
Quality-Adjusted Exams Per Test Taker 3.3
Layout
Newton South is divided into four sections known as houses. The houses are Goldrick, which contains the History and English departments, as well as the Preschool; Wheeler, which contains the English department and some math and science rooms; Cutler, which contains the Math and Science departments; and Goodwin, which contains the World language department. Building 1 is Goldrick; 2 is Wheeler; 3 is the science wing; 4 is Cutler; 5 is the field house and associated wellness classrooms; 6 is Goodwin; 7 is the cafeteria and the college and career resource room; 8 is the administrative section; and 9 is the arts wing, which also contains the Van Seasholes Auditorium.
Organization
Newton South places all students into one of four houses, in which they remain for the duration of high school. Unlike many other schools, the houses at Newton South are only for administrative and attendance purposes. They have no effect on the courses or activities of students, except for most students’ homerooms.
Partnerships
The Newton-Beijing Jingshan School Exchange Program is the oldest exchange of public secondary school students between the United States and the People’s Republic of China. The city of Newton hosts Chinese students and teachers for four months each fall and sends students and teachers to Beijing each spring. It has become a tradition for the Jingshan students to give an entertaining presentation on their culture to the school shortly before returning to their country.
Newton has also had a long-standing relationship with its sister city of San Juan Del Sur, Nicaragua. Every February, a small group of Newton South students go to Nicaragua to live with local families and perform community service.