
Top 100 Best STEM High Schools – Redwood High – US News & World Report – 61/100
Top 100 Best STEM High Schools – Redwood High – US News & World Report – 61/100
Redwood High
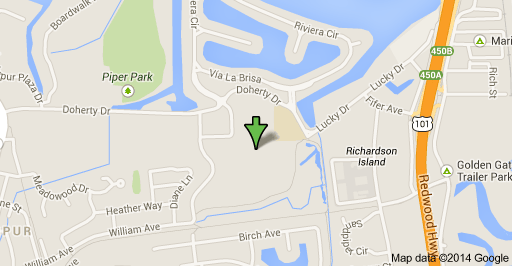
395 DOHERTY DR
LARKSPUR, CA 94939
Phone: (415) 945-3620
District: Tamalpais Union High
| 395 Doherty Drive Larkspur, California, United States |
|
| Coordinates |  37°56′17″N 122°31′27″W 37°56′17″N 122°31′27″W |
|---|---|
| Information | |
| Type | Public school |
| Established | 1958 |
| School district | Tamalpais Union High School District |
| School code | CEEB 051-361 |
| Principal | David Sondheim |
| Assistant principals | Liz Chacón Katy Foster LaSandra White |
| Faculty | 86 teachers; 9.3 FTE counselors & support staff (2011–2012)[2] |
| Grades | 9–12 |
| Number of students | 1456 (2011–2012)[2] |
| Grade 9 | 359 |
| Grade 10 | 391 |
| Grade 11 | 380 |
| Grade 12 | 326 |
| Campus | Suburban |
| Color(s) | Red & Grey |
| Athletics conference | North Coast Section (NCS), Marin County Athletic League (MCAL) |
| Mascot | “Big Red” (Giant) |
| Team name | Giants |
| Rival | Marin Catholic High School |
| Newspaper | Redwood Bark |
| Yearbook | The Log |
| Feeder schools | Del Mar Middle School Hall Middle School Kent Middle School Ross Middle School |
| Website | www.redwood.org |
Local Map
Overview
Redwood High is ranked 32nd within California. Students have the opportunity to take Advanced Placement® course work and exams. The AP® participation rate at Redwood High is 63 percent. The student body makeup is 50 percent male and 50 percent female, and the total minority enrollment is 22 percent. Redwood High is 1 of 5 high schools in the Tamalpais Union High.
Rankings / Awards
This details how this school compares to others based on U.S. News ranking criteria.
Medal Awarded Gold
National Rank
#199
State Rank
#32
STEM Rank
#61
See Best High Schools in California
Students / Teachers
These counts and percentages of students and teachers are from data reported by schools to the government.
Total Enrollment 1,458
Total Minority Enrollment (% of total) 22%
Total Economically Disadvantaged (% of total) 6%
Full-Time Teachers N/A
More About Student Body
Test Scores
U.S. News calculates these values based on student performance on state exit exams and internationally available exams on college-level coursework (AP®/IB exams).
Academic Performance Index Evaluation Achieves CA goal
College Readiness Index 60.7
More about Test Scores
School Data
School profile information is based on government data.
Grades Served 09 – 12
Setting Large Suburb
Charter School No
Magnet School No
Receives Title I Funding No
District
This information relates to high schools run by this school’s state operating agency. Many districts contain only one high school.
Total Schools 5
Total Students 3,822
Academic Performance Index Evaluation Does not achieve CA goal
College Readiness (district average) 44.4
Total Enrollment 1,458
9th Grade 390 Students
10th Grade 374 Students
11th Grade 325 Students
12th Grade 369 Students
Student Diversity
This is the breakdown of ethnicity and gender of a school’s student body, based on data reported to the government.
Ethnicity/Race
Total Minority Enrollment (% of total) 22%
American Indian/Alaskan Native Enrollment (% of total) 0%
Asian Enrollment (% of total) 6%
Black Enrollment (% of total) 2%
Hawaiian Native/Pacific Islander (% of total) 0.3%
Hispanic Enrollment (% of total) 7%
White Enrollment (% of total) 78%
Two or More Races Enrollment (% of total) 6%
Gender
Male (% of total) 50%
Female (% of total) 50%
Economically Disadvantaged Students
These are the percentages of the school’s students eligible for free or reduced-price lunch, based on data reported to the government.
Free Lunch Program (% of total) 4%
Reduced-Price Lunch Program (% of total) 2%
Total Economically Disadvantaged (% of total) 6%
Academic Performance Index
Academic Performance Index is based on California High School Exit Examination and Standardized Testing and Reporting results.
Total Students Tested 1,036
Academic Performance Index 899
Overall Student Performance
This measures overall student performance on state exams. The calculations by U.S. News were the first of two steps in determining which schools received at least a bronze medal.
State Test Performance Index 899.0
Risk-Adjusted Performance Index 135.5
Disadvantaged Student Performance
This measures the proficiency on state exams among typically underperforming subgroups. The calculations by U.S. News were the second of two steps in determining which schools received at least a bronze medal.
Percentage of Disadvantaged Students Who Are Proficient 774.2
Percentage of Non-Disadvantaged Students Who Are Proficient 912.0
Gap Between Disadvantaged and Non-Disadvantaged Students -137.8
Gap Between School and State Among Disadvantaged Students 77.2
College-Ready Student Performance
High school students take AP® and IB exams to earn college credit and demonstrate success at college-level course work. U.S. News calculated a College Readiness Index based on exam participation rates and percentages of students passing at least one exam. The Index determined which types of medals (gold, silver or bronze) were awarded to top-performing schools.
College Readiness Index 60.7
Exam Used for Index AP®
Advanced Placement® (AP®) Student Performance
Many U.S. higher educational institutions grant credits or advanced placement based on student performance on AP® exams. This shows this school’s student participation and performance on these exams if data were available. (N/A means no students participated.)
Participation Rate 63%
Participant Passing Rate 95%
Exams Per Test Taker 3.4
Exam Pass Rate 90%
Quality-Adjusted Participation Rate 60%
Quality-Adjusted Exams Per Test Taker 3.3