Top 100 Best STEM High Schools – Loveless Academic Magnet Program High School – US News & World Report – 99/100
Top 100 Best STEM High Schools – Loveless Academic Magnet Program High School – US News & World Report – 99/100
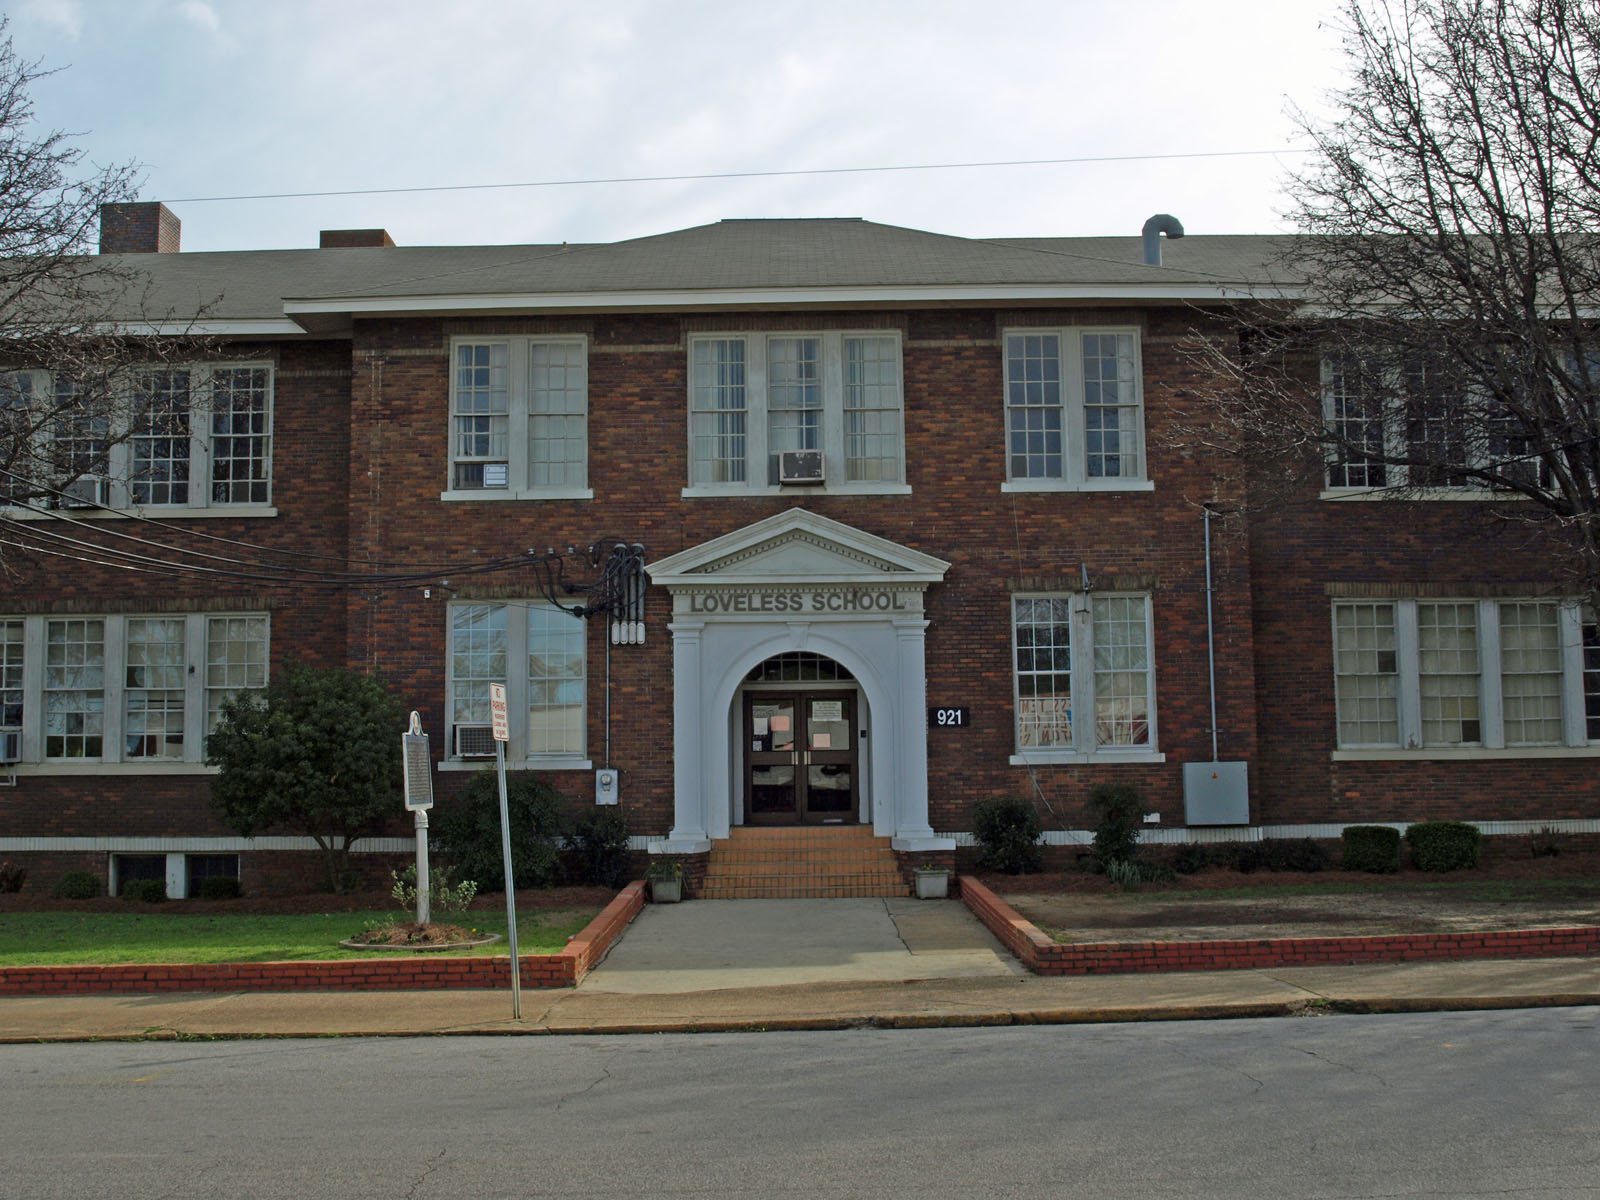
Loveless Academic Magnet Program High School
921 WEST JEFF DAVIS
MONTGOMERY, AL 36108
Phone: (334) 269-3839
District: Montgomery County
Overview
Loveless Academic Magnet Program High School (LAMP) places a strong emphasis on parent engagement through newsletters, conferences, volunteering, and fundraising opportunities. The school’s curriculum includes a variety of Advanced Placement courses, as well as competitive academic groups such as the Scholar’s Bowl and Science Olympiad. Extracurricular activities at Loveless Academic Magnet Program include Model United Nations and the forensics club, among others. Admission to LAMP is selective, and based on proven academic excellence.
Local Map

Rankings / Awards
This details how this school compares to others based on U.S. News ranking criteria.
Medal Awarded Gold
National Rank
#7
State Rank
#1
Magnet Rank
#1
STEM Rank
#99
See Best High Schools in Alabama
Students / Teachers
These counts and percentages of students and teachers are from data reported by schools to the government.
Total Enrollment 448
Total Minority Enrollment (% of total) 55%
Total Economically Disadvantaged (% of total) 13%
Full-Time Teachers 30
More About Student Body
Test Scores
U.S. News calculates these values based on student performance on state exit exams and internationally available exams on college-level course work (AP®/IB exams).
Proficient in English 99%
Proficient in Math 100%
College Readiness Index 100.0
More About Test Scores
School Data
School profile information is based on government data.
Grades Served 09 – 12
Setting Mid-size City
Charter School No
Magnet School Yes
Receives Title I Funding No
District
This information relates to high schools run by this school’s state operating agency. Many districts contain only one high school.
Total Schools 7
Total Students 7,990
Proficient in English (district average) 85%
Proficient in Math (district average) 82%
College Readiness (district average) 30.2
Total Enrollment 448
9th Grade 138 Students
10th Grade 116 Students
11th Grade 111 Students
12th Grade 83 Students
Student Diversity
This is the breakdown of ethnicity and gender of a school’s student body, based on data reported to the government.
Ethnicity/Race
Total Minority Enrollment (% of total) 55%
American Indian/Alaskan Native Enrollment (% of total) 0.4%
Asian Enrollment (% of total) 21%
Black Enrollment (% of total) 30%
Hawaiian Native/Pacific Islander (% of total) 0.2%
Hispanic Enrollment (% of total) 3%
White Enrollment (% of total) 45%
Two or More Races Enrollment (% of total) 0%
Gender
Male (% of total) 39%
Female (% of total) 61%
Economically Disadvantaged Students
These are the percentages of the school’s students eligible for free or reduced-price lunch, based on data reported to the government.
Free Lunch Program (% of total) 9%
Reduced-Price Lunch Program (% of total) 3%
Total Economically Disadvantaged (% of total) 13%
English Proficiency Distribution
English proficiency is determined by student results on the school’s Alabama High School Graduation Exam.
Total Students Tested 109
Does Not Meet or Partially Meets Academic Content Standards 1%
Meets Academic Content Standards 33%
Exceeds Academic Content Standards 66%
Math Proficiency Distribution
Math proficiency is determined by student results on the school’s Alabama High School Graduation Exam.
Total Students Tested 109
Does Not Meet or Partially Meets Academic Content Standards 0%
Meets Academic Content Standards 7%
Exceeds Academic Content Standards 93%
Overall Student Performance
This measures overall student performance on state exams. The calculations by U.S. News were the first of two steps in determining which schools received at least a bronze medal.
State Test Performance Index 139.4
Risk-Adjusted Performance Index 30.8
Disadvantaged Student Performance
This measures the proficiency on state exams among typically underperforming subgroups. The calculations by U.S. News were the second of two steps in determining which schools received at least a bronze medal.
Percentage of Disadvantaged Students Who Are Proficient 100.0
Percentage of Non-Disadvantaged Students Who Are Proficient 99.8
Gap Between Disadvantaged and Non-Disadvantaged Students 0.2
Gap Between School and State Among Disadvantaged Students 16.6
College-Ready Student Performance
High school students take AP® and IB exams to earn college credit and demonstrate success at college-level course work. U.S. News calculated a College Readiness Index based on exam participation rates and percentages of students passing at least one exam. The Index determined which types of medals (gold, silver or bronze) were awarded to top-performing schools.
College Readiness Index 100.0
Exam Used for Index AP®
Advanced Placement® (AP®) Student Performance
Many U.S. higher educational institutions grant credits or advanced placement based on student performance on AP® exams. This shows this school’s student participation and performance on these exams if data were available. (N/A means no students participated.)
Participation Rate 100%
Participant Passing Rate 94%
Exams Per Test Taker 7.1
Exam Pass Rate 70%
Quality-Adjusted Participation Rate 100%
Quality-Adjusted Exams Per Test Taker 5.3