
American Real Estate – Homes (1/2)
Updated on 03/14/2017
United States
$195,300
Data through January 31,2017
United States Market Overview
- 3.0% 1-yr forecast (Jan 31, 2018)
- $234,900 Median listing price
- No data Median sale price
United States Market Health
- No recent data
- 94 Average days on Zillow (Dec 31, 2016)
- 0.1% Homes with negative equity (Sep 30, 2016)
- 0.0% Delinquent on mortgage (Sep 30, 2016)
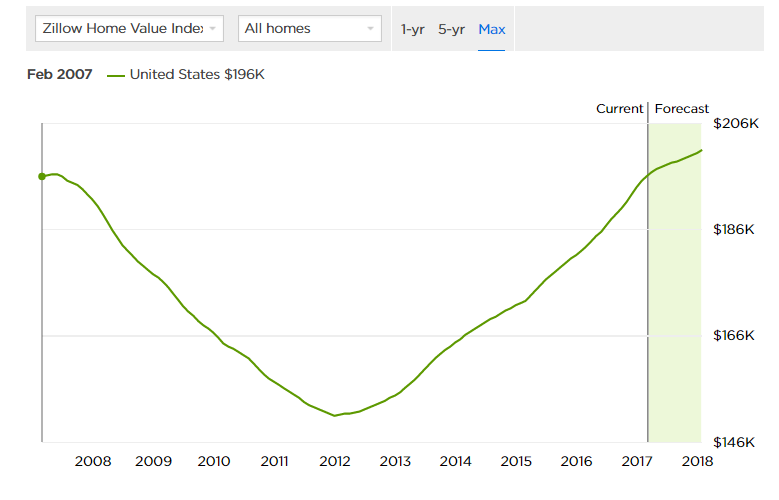
The median home value in the United States is $195,300. United States home values have gone up 7.2% over the past year and Zillow predicts they will rise 3.0% within the next year. The median list price per square foot in the United States is $130. The median price of homes currently listed in the United States is $234,900. The median rent price in the United States is $1,500.
Foreclosures will be a factor impacting home values in the next several years. In the United States 1.4 homes are foreclosed (per 10,000).
With U.S. home values having fallen by more than 20% nationally from their peak in 2007 until their trough in late 2011, many homeowners are now underwater on their mortgages, meaning they owe more than their home is worth. The percent of United States homeowners underwater on their mortgage is 0.1%.
New York City
$631,300
Data through January 31,2017
MARKET TEMPERATURE Hot
- 4.7% 1-yr forecast (Jan 31, 2018)
- $729,000 Median listing price
- No data Median sale price
Market Health
- 9.2/10 Very healthy
- No data Average days on Zillow
- 0.1% Homes with negative equity (0.1% US Avg) (Sep 30, 2016)
- 0.0% Delinquent on mortgage (0.0% US Avg) (Sep 30, 2016)
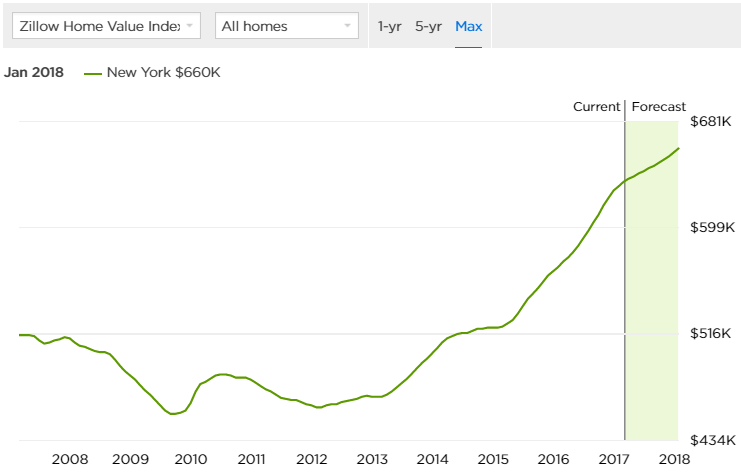
The median home value in New York is $631,300. New York home values have gone up 11.0% over the past year and Zillow predicts they will rise 4.7% within the next year. The median price of homes currently listed in New York is $729,000. The median rent price in New York is $2,950, which is higher than the New York Metro median of $2,700.
Foreclosures will be a factor impacting home values in the next several years. In New York 0.0 homes are foreclosed (per 10,000). This is lower than the New York Metro value of 1.1 and also lower than the national value of 1.4
Mortgage delinquency is the first step in the foreclosure process. This is when a homeowner fails to make a mortgage payment. The percent of delinquent mortgages in New York is 0.0%, which is higher than the national value of 0.0%. With U.S. home values having fallen by more than 20% nationally from their peak in 2007 until their trough in late 2011, many homeowners are now underwater on their mortgages, meaning they owe more than their home is worth. The percent of New York homeowners underwater on their mortgage is 0.1%, which is lower than New York Metro at 0.1%.
Los Angeles
$611,600
Data through January 31,2017
MARKET TEMPERATURE Cool
- 1.5% 1-yr forecast (Jan 31, 2018)
- $709,000 Median listing price
- No data Median sale price
Market health
- 7.2/10 Healthy
- No data Average days on Zillow
- 0.1% Homes with negative equity (0.1% US Avg) (Sep 30, 2016)
- 0.0% Delinquent on mortgage (0.0% US Avg) (Sep 30, 2016)
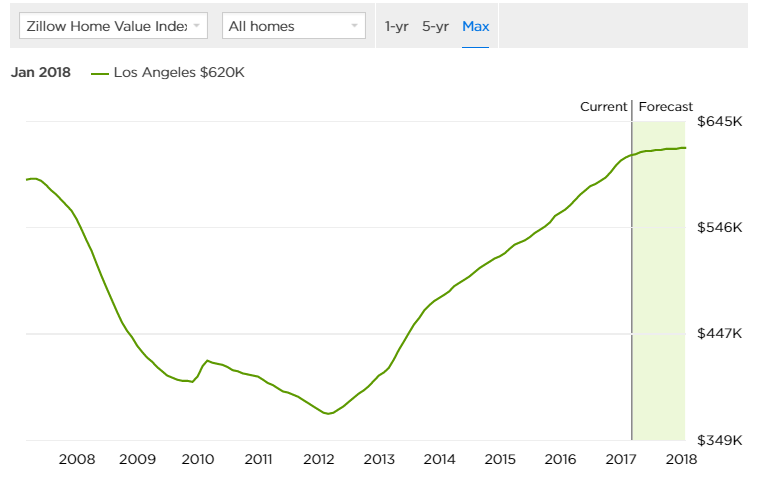
The median home value in Los Angeles is $611,600. Los Angeles home values have gone up 8.4% over the past year and Zillow predicts they will rise 1.5% within the next year. The median list price per square foot in Los Angeles is $455, which is higher than the Los Angeles-Long Beach-Anaheim Metro average of $392. The median price of homes currently listed in Los Angeles is $709,000. The median rent price in Los Angeles is $3,300, which is higher than the Los Angeles-Long Beach-Anaheim Metro median of $2,850.
Foreclosures will be a factor impacting home values in the next several years. In Los Angeles 1.2 homes are foreclosed (per 10,000). This is greater than the Los Angeles-Long Beach-Anaheim Metro value of 1.0 and also lower than the national value of 1.4
Mortgage delinquency is the first step in the foreclosure process. This is when a homeowner fails to make a mortgage payment. The percent of delinquent mortgages in Los Angeles is 0.0%, which is lower than the national value of 0.0%. With U.S. home values having fallen by more than 20% nationally from their peak in 2007 until their trough in late 2011, many homeowners are now underwater on their mortgages, meaning they owe more than their home is worth. The percent of Los Angeles homeowners underwater on their mortgage is 0.1%, which is lower than Los Angeles-Long Beach-Anaheim Metro at 0.1%.
San Francisco
$1,148,700
Data through January 31,2017
MARKET TEMPERATURE Warm
- 0.4% 1-yr forecast (Jan 31, 2018)
- $1,158,000 Median listing price
- No data Median sale price
- 7.3/10 Healthy
- No data Average days on Zillow
- 0.0% Homes with negative equity (0.1% US Avg) (Sep 30, 2016)
- 0.0% Delinquent on mortgage (0.0% US Avg) (Sep 30, 2016)
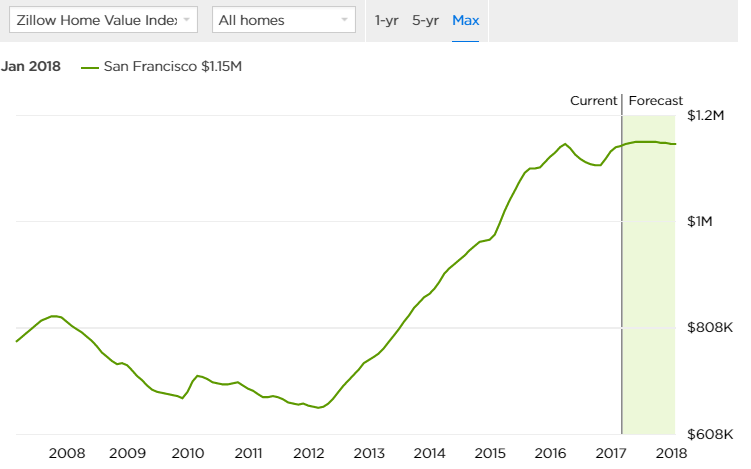
The median home value in San Francisco is $1,148,700. San Francisco home values have gone up 1.0% over the past year and Zillow predicts they will rise 0.4% within the next year. The median list price per square foot in San Francisco is $963, which is higher than the San Francisco Metro average of $467. The median price of homes currently listed in San Francisco is $1,158,000. The median rent price in San Francisco is $4,170, which is higher than the San Francisco Metro median of $3,200.
Foreclosures will be a factor impacting home values in the next several years. In San Francisco 0.3 homes are foreclosed (per 10,000). This is lower than the San Francisco Metro value of 0.8 and also lower than the national value of 1.4
Mortgage delinquency is the first step in the foreclosure process. This is when a homeowner fails to make a mortgage payment. The percent of delinquent mortgages in San Francisco is 0.0%, which is lower than the national value of 0.0%. With U.S. home values having fallen by more than 20% nationally from their peak in 2007 until their trough in late 2011, many homeowners are now underwater on their mortgages, meaning they owe more than their home is worth. The percent of San Francisco homeowners underwater on their mortgage is 0.0%, which is lower than San Francisco Metro at 0.0%.
San Jose
$852,200
Data through January 31,2017
Market overview
- 0.7% 1-yr forecast (Jan 31, 2018)
- $765,000 Median listing price
- No data Median sale price
Market health
- 8.0/10 Very healthy
- No data Average days on Zillow
- 0.0% Homes with negative equity (0.1% US Avg) (Sep 30, 2016)
- 0.0% Delinquent on mortgage (0.0% US Avg) (Sep 30, 2016)
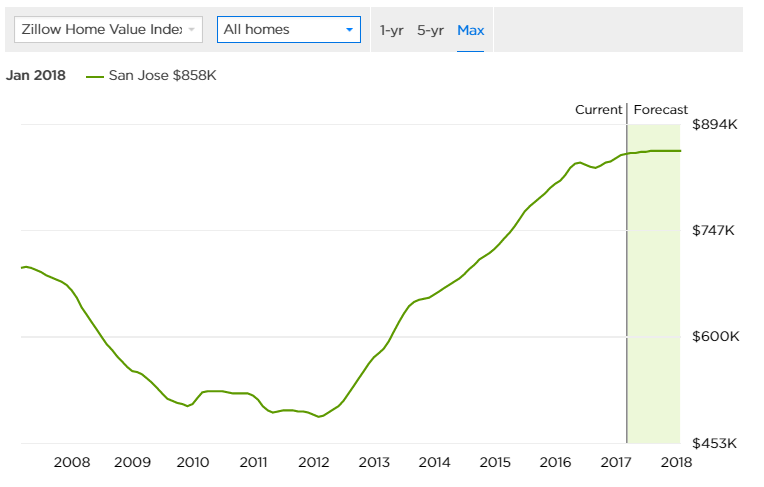
The median home value in San Jose is $852,200. San Jose home values have gone up 4.3% over the past year and Zillow predicts they will rise 0.7% within the next year. The median list price per square foot in San Jose is $501, which is lower than the San Jose Metro average of $527. The median price of homes currently listed in San Jose is $765,000. The median rent price in San Jose is $3,100, which is lower than the San Jose Metro median of $3,295.
Foreclosures will be a factor impacting home values in the next several years. In San Jose 0.5 homes are foreclosed (per 10,000). This is the same as the San Jose Metro value of 0.5 and also lower than the national value of 1.4
Mortgage delinquency is the first step in the foreclosure process. This is when a homeowner fails to make a mortgage payment. The percent of delinquent mortgages in San Jose is 0.0%, which is lower than the national value of 0.0%. With U.S. home values having fallen by more than 20% nationally from their peak in 2007 until their trough in late 2011, many homeowners are now underwater on their mortgages, meaning they owe more than their home is worth. The percent of San Jose homeowners underwater on their mortgage is 0.0%, which is higher than San Jose Metro at 0.0%.