Top 100 Best STEM High Schools – West Windsor-Plainsboro High School South – US News & World Report – 19/100
Top 100 Best STEM Schools – US News & World Report – 19/100
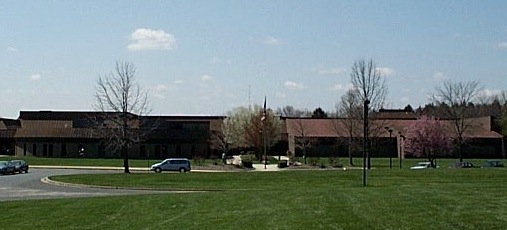
West Windsor-Plainsboro High School South
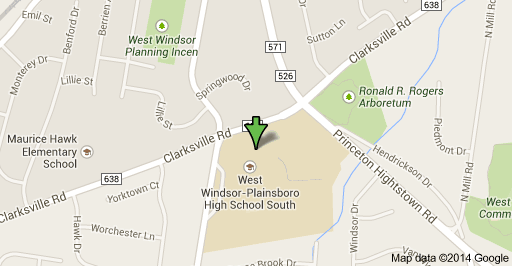
346 CLARKSVILLE RD
PRINCETON JCT, NJ 08550
Phone: (609) 716-5050
District: West Windsor-Plainsboro R
Overview
West Windsor-Plainsboro High School South is ranked 8th within New Jersey. Students have the opportunity to take Advanced Placement® course work and exams. The AP® participation rate at West Windsor-Plainsboro High School South is 70 percent. The student body makeup is 52 percent male and 48 percent female, and the total minority enrollment is 58 percent. West Windsor-Plainsboro High School South is 1 of 2 high schools in the West Windsor-Plainsboro R.
Local Map
Rankings / Awards
This details how this school compares to others based on U.S. News ranking criteria.
Medal Awarded Gold
National Rank
#162
State Rank
#8
STEM Rank
#19
See Best High Schools in New Jersey
Students / Teachers
These counts and percentages of students and teachers are from data reported by schools to the government.
Total Enrollment 1,606
Total Minority Enrollment (% of total) 58%
Total Economically Disadvantaged (% of total) 4%
Full-Time Teachers 105
More About Student Body
Test Scores
U.S. News calculates these values based on student performance on state exit exams and internationally available exams on college-level course work (AP®/IB exams).
Proficient in Language 96%
Proficient in Math 93%
College Readiness Index 64.5
More About Test Scores
School Data
School profile information is based on government data.
Grades Served 09 – 12
Setting Small Suburb
Charter School No
Magnet School No
Receives Title I Funding No
District
This information relates to high schools run by this school’s state operating agency. Many districts contain only one high school.
Total Schools 2
Total Students 3,204
Proficient in Language (district average) 97%
Proficient in Math (district average) 93%
College Readiness (district average) 61.5
Total Enrollment 1,606
9th Grade 382 Students
10th Grade 407 Students
11th Grade 406 Students
12th Grade 411 Students
Student Diversity
This is the breakdown of ethnicity and gender of a school’s student body, based on data reported to the government.
Ethnicity/Race
Total Minority Enrollment (% of total) 58%
American Indian/Alaskan Native Enrollment (% of total) 0%
Asian Enrollment (% of total) 45%
Black Enrollment (% of total) 6%
Hawaiian Native/Pacific Islander (% of total) 0%
Hispanic Enrollment (% of total) 6%
White Enrollment (% of total) 42%
Two or More Races Enrollment (% of total) 0.1%
Gender
Male (% of total) 52%
Female (% of total) 48%
Economically Disadvantaged Students
These are the percentages of the school’s students eligible for free or reduced-price lunch, based on data reported to the government.
Free Lunch Program (% of total) 3%
Reduced-Price Lunch Program (% of total) 1%
Total Economically Disadvantaged (% of total) 4%
Language Proficiency Distribution
Language proficiency is determined by student results on the school’s High School Proficiency Assessment test.
Total Students Tested 404
Partially Proficient 4%
Proficient 46%
Advanced 51%
Math Proficiency Distribution
Math proficiency is determined by student results on the school’s High School Proficiency Assessment test.
Total Students Tested 404
Partially Proficient 7%
Proficient 30%
Advanced 63%
Overall Student Performance
This measures overall student performance on state exams. The calculations by U.S. News were the first of two steps in determining which schools received at least a bronze medal.
State Test Performance Index 123.3
Risk-Adjusted Performance Index 15.2
Disadvantaged Student Performance
This measures the proficiency on state exams among typically underperforming subgroups. The calculations by U.S. News were the second of two steps in determining which schools received at least a bronze medal.
Percentage of Disadvantaged Students Who Are Proficient 80.0
Percentage of Non-Disadvantaged Students Who Are Proficient 95.8
Gap Between Disadvantaged and Non-Disadvantaged Students -15.8
Gap Between School and State Among Disadvantaged Students 12.5
College-Ready Student Performance
High school students take AP® and IB exams to earn college credit and demonstrate success at college-level course work. U.S. News calculated a College Readiness Index based on exam participation rates and percentages of students passing at least one exam. The Index determined which types of medals (gold, silver or bronze) were awarded to top-performing schools.
College Readiness Index 64.5
Exam Used for Index AP®
Advanced Placement® (AP®) Student Performance
Many U.S. higher educational institutions grant credits or advanced placement based on student performance on AP® exams. This shows this school’s student participation and performance on these exams if data were available. (N/A means no students participated.)
Participation Rate 70%
Participant Passing Rate 90%
Exams Per Test Taker 3.9
Exam Pass Rate 92%
Quality-Adjusted Participation Rate 63%
Quality-Adjusted Exams Per Test Taker 4.0
West Windsor-Plainsboro High School South is a four-year comprehensive public high school located in Princeton Junction in Mercer County, New Jersey, serving students in ninth through twelfth grades. The school is part of the West Windsor-Plainsboro Regional School District, a regional school district serving students from West Windsor Township (in Mercer County) and Plainsboro Township (in Middlesex County).
The high school was opened in September 1973 as West Windsor-Plainsboro High School and was described by The New York Times as the state’s first high school to be developed with an “open space” plan, with open areas that could be divided off for instructional space. The school, constructed at a cost of $8 million, initially served 700 students in grades 7 to 10, while the remaining students in grades 11 and 12 finished their schooling at Princeton High School. In 1997, the school was renamed by appending “South” to the school’s name, because of the opening of West Windsor-Plainsboro High School North.
As of the 2010-11 school year, the school had an enrollment of 1,606 students and 105.2 classroom teachers (on an FTE basis), for a student–teacher ratio of 15.27:1. There were 48 students (3.0% of enrollment) eligible for free lunch and 20 (1.2% of students) eligible for reduced-cost lunch.