Top 100 Best STEM High Schools – Michael E. DeBakey High School for Health Professions – US News & World Report – 31/100
Top 100 Best STEM High Schools – Michael E. DeBakey High School for Health Professions – US News & World Report – 31/100
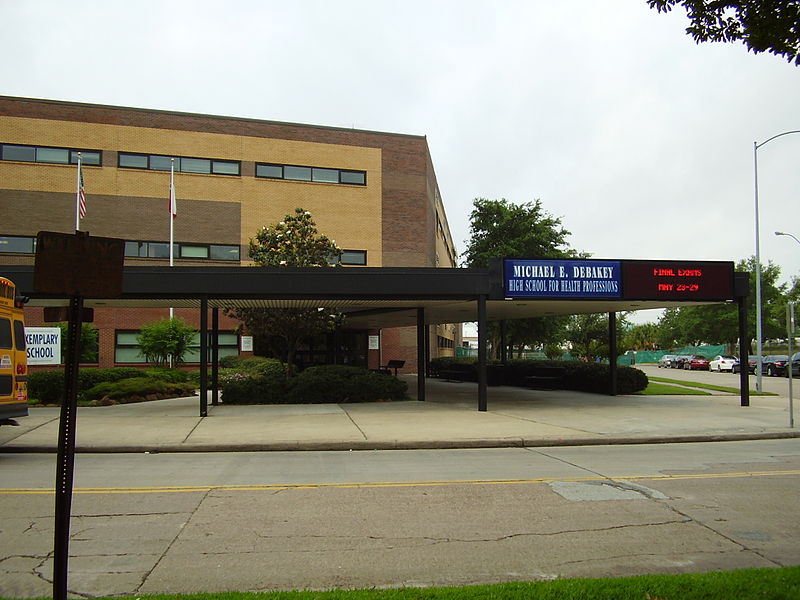
Michael E. DeBakey High School for Health Professions
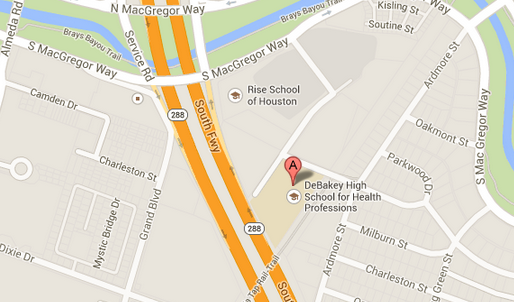
3100 SHENANDOAH ST
HOUSTON, TX 77021
Phone: (713) 741-2410
District: Houston Independent School District
Local Map
Overview
DeBakey High School for Health Professions is located on the Texas Medical Center campus, and students have access to research facilities and academic programs at the center. Graduates are eligible for the Houston Premedical Academy, an undergraduate program at the University of Houston designed specifically for DeBakey High School students. Those selected for the premedical academy receive provisional acceptance to the Baylor College of Medicine. DeBakey’s Parent Teacher Association provides volunteers and sponsors school activities.
Rankings / Awards
This details how this school compares to others based on U.S. News ranking criteria.
Medal Awarded Gold
National Rank
#26
State Rank
#5
Magnet Rank
#10
STEM Rank
#31
See Best High Schools in Texas
Students / Teachers
These counts and percentages of students and teachers are from data reported by schools to the government.
Total Enrollment 865
Total Minority Enrollment (% of total) 92%
Total Economically Disadvantaged (% of total) 42%
Full-Time Teachers 57
More About Student Body
Test Scores
U.S. News calculates these values based on student performance on state exit exams and internationally available exams on college-level course work (AP®/IB exams).
Proficient in Reading 100%
Proficient in Math 100%
College Readiness Index 95.7
More About Test Scores
School Data
School profile information is based on government data.
Grades Served 09 – 12
Setting Large City
Charter School No
Magnet School Yes
Receives Title I Funding Yes
District
This information relates to high schools run by this school’s state operating agency. Many districts contain only one high school.
Total Schools 47
Total Students 47,830
Proficient in Reading (district average) 89%
Proficient in Math (district average) 83%
College Readiness (district average) 27.6
Total Enrollment 865
9th Grade 236 Students
10th Grade 222 Students
11th Grade 198 Students
12th Grade 209 Students
Student Diversity
This is the breakdown of ethnicity and gender of a school’s student body, based on data reported to the government.
Ethnicity/Race
Total Minority Enrollment (% of total) 92%
American Indian/Alaskan Native Enrollment (% of total) 0.2%
Asian Enrollment (% of total) 37%
Black Enrollment (% of total) 23%
Hawaiian Native/Pacific Islander (% of total) 0.5%
Hispanic Enrollment (% of total) 30%
White Enrollment (% of total) 8%
Two or More Races Enrollment (% of total) 1%
Gender
Male (% of total) 42%
Female (% of total) 58%
Economically Disadvantaged Students
These are the percentages of the school’s students eligible for free or reduced-price lunch, based on data reported to the government.
Free Lunch Program (% of total) 27%
Reduced-Price Lunch Program (% of total) 15%
Total Economically Disadvantaged (% of total) 42%
Reading Proficiency Distribution
Reading proficiency is determined by student results on the school’s Texas Assessment of Knowledge and Skills test.
Total Students Tested 196
Did Not Meet Standard 0%
Met Standard 26%
Commended Performance 74%
Math Proficiency Distribution
Math proficiency is determined by student results on the school’s Texas Assessment of Knowledge and Skills test.
Total Students Tested 196
Did Not Meet Standard 0%
Met Standard 5%
Commended Performance 95%
Overall Student Performance
This measures overall student performance on state exams. The calculations by U.S. News were the first of two steps in determining which schools received at least a bronze medal.
State Test Performance Index 140.3
Risk-Adjusted Performance Index 45.7
Disadvantaged Student Performance
This measures the proficiency on state exams among typically underperforming subgroups. The calculations by U.S. News were the second of two steps in determining which schools received at least a bronze medal.
Percentage of Disadvantaged Students Who Are Proficient 100.0
Percentage of Non-Disadvantaged Students Who Are Proficient 100.0
Gap Between Disadvantaged and Non-Disadvantaged Students 0.0
Gap Between School and State Among Disadvantaged Students 17.0
College-Ready Student Performance
High school students take AP® and IB exams to earn college credit and demonstrate success at college-level course work. U.S. News calculated a College Readiness Index based on exam participation rates and percentages of students passing at least one exam. The Index determined which types of medals (gold, silver or bronze) were awarded to top-performing schools.
College Readiness Index 95.7
Exam Used for Index AP®
Advanced Placement® (AP®) Student Performance
Many U.S. higher educational institutions grant credits or advanced placement based on student performance on AP® exams. This shows this school’s student participation and performance on these exams if data were available. (N/A means no students participated.)
Participation Rate 100%
Participant Passing Rate 93%
Exams Per Test Taker 4.4
Exam Pass Rate 84%
Quality-Adjusted Participation Rate 94%
Quality-Adjusted Exams Per Test Taker 3.9
Comment/s
“Hi….I have a beautiful technology to measure student´s competencies to value Life in General and Student Life, based on Scientific Axiology. This is of utmost importance to any student, along with their parents, teachers, mentors, etc.”-Abel Jiménez Martínez · UANL Preparatoria 7.