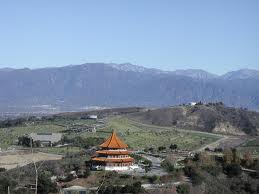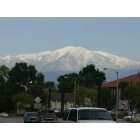
Hacienda Heights, Los Angeles County, CA 91745
Hacienda Heights, Los Angeles County, CA 91745
Estimated zip code population in 2011: 55,723
Zip code population in 2010: 54,013
Zip code population in 2000: 53,682
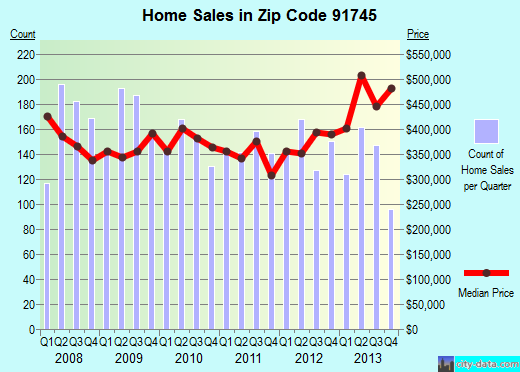
Recent home sales, real estate maps, and home value estimator for zip code 91745
Houses and condos: 17,138
Renter-occupied apartments: 3,132
| % of renters here: |
19% |
| State: |
45% |
Mar. 2012 cost of living index in zip code 91745: 129.1 (high, U.S. average is 100)
Land area: 12.8 sq. mi.
Water area: 0.0 sq. mi.
| Population density: 4,351 people per square mile |
|
(average). |
Real estate property taxes paid for housing units in 2011:
| This zip code: |
0.6% ($3,022) |
| California: |
0.8% ($2,907) |
Median real estate property taxes paid for housing units with mortgages in 2011: $3,330 (0.7%)
Median real estate property taxes paid for housing units with no mortgage in 2011: $2,173 (0.5%)
| Males: 26,383 | |
| Females: 29,340 |
For population 25 years and over in 91745:
- High school or higher: 84.3%
- Bachelor’s degree or higher: 33.3%
- Graduate or professional degree: 9.5%
- Unemployed: 7.5%
- Mean travel time to work (commute): 33.2 minutes
For population 15 years and over in 91745:
- Never married: 30.1%
- Now married: 54.9%
- Separated: 1.6%
- Widowed: 6.1%
- Divorced: 7.2%
Zip code 91745 compared to state average:
- Black race population percentage significantly below state average.
- Median age above state average.
- Foreign-born population percentage above state average.
- Renting percentage significantly below state average.
- Number of rooms per house above state average.
Neighborhoods in zip code 91745:
Percentage of zip code residents living and working in this county: 84.6%
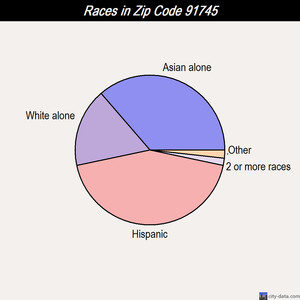
Races in zip code 91745:
White population: 8,029
Black population: 644
American Indian population: 68
Asian population: 19,875
Native Hawaiian and Other Pacific Islander population: 63
Some other race population: 70
Two or more races population: 671
Hispanic or Latino population: 24,593