
Real Estate Outlook 4/4
Commercial Real Estate
CRE Risks in an Aging Business Cycle
U.S. financial regulators and market observers are focused on the rise in commercial real estate (CRE) prices, with some ringing the alarm that the recent surge in valuations is unsustainable. In a lateAugust speech, Boston Fed President Eric Rosengren said, “should prevailing economic conditions change in response to a large negative shock, CRE prices could decline relatively quickly, leading to large losses at leveraged firms.”1 According to Moody’s/RCA Commercial Property Price Index (CPPI), the all-property index level stands well above its prerecession peak, with much of the increase concentrated in apartments and the office central business districts in major markets. Moreover, crossborder transactions are fueling pricing, with activity reaching an all-time peak of more than $100 billion in late-2015. Since 2010, Canada was the largest source of cross-border capital in the major property types. However, activity has softened somewhat in recent quarters as investment in key property types has slowed. Year-to-date, cross-border activity from China is up almost three times the level reached in 2015, making the country the leading source of foreign capital.
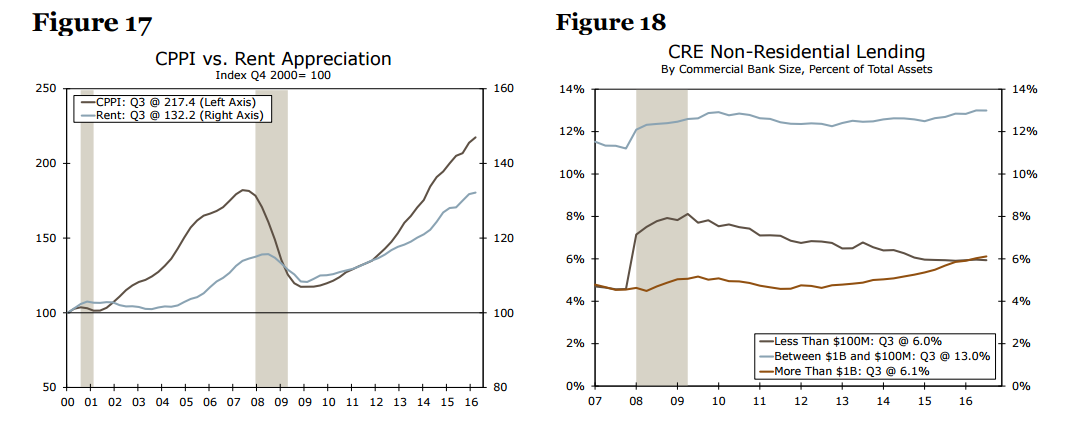
Although the level of pricing remains elevated, the year-over-year pace is moderating and transaction volume is also down, suggesting that the asset price cycle is maturing. At any one time, there are three distinct CRE cycles: nonresidential construction, which is related to real GDP growth; asset pricing, which is closely tied to the banking industry; and the space market, where local economic fundamentals are determined. Although the cycles are related, they do not always move in tandem e.g., during the 2007-2009 cycle, rent peaked one year after pricing (Figure 17). 3 With the level of overall valuations at all-time highs, it is understandable that there is some angst. Indeed, previous CRE cycles show that a collapse in pricing typically poses the most significant risk to overall economic activity, but the channel is through the banking system.
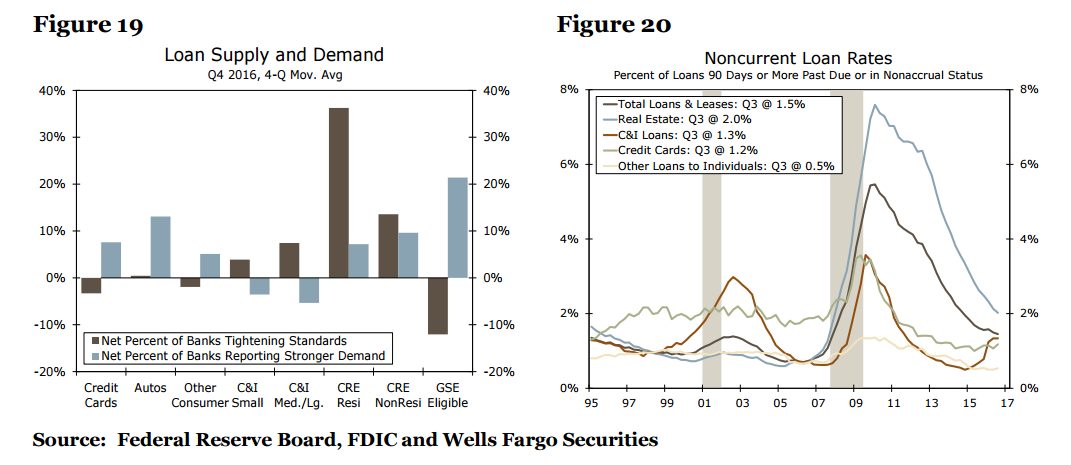
For the banking sector, the total share of income-producing and multifamily loans sitting on large- and mid-sized bank balance sheets as a percentage of assets is gradually climbing. The share of CRE loans at large banks as a percentage of assets is 6.1 percent, which is 1.5 percentage points above the prerecession peak (Figure 18). Mid-sized banks’ share is 13.0 percent, compared to an 11.2 percent peak preceding the recession. We suspect tighter lending standards will help curb some of the growth. According to the Federal Reserve’s Senior Loan Officer Opinion Survey, lending standards for CRE loans remain tight, with a “significant” number of banks reporting stricter underwriting guidelines in multifamily and construction loans, while demand across property types continues to increase. Moreover, construction loans on bank balance sheets, which are seen as the most risky, are well below the precession peak.
We are also watching the commercial mortgage-backed securities (CMBS) market, which comprises about 15 percent of mortgages outstanding, as risk retention guidelines set under the Dodd-Frank statute go into effect on December 24. The guidelines require the sponsor of CMBS debt to hold a minimum of 5 percent interest, which will provide some “skin in the game.” The tighter regulatory environment could slow CMBS issuance, which means that balance sheet and insurance lenders would have to fill any funding gap. There are constraints, however. Another risk in the CMBS space is maturing loans originated in 2007, especially as rates begin to rise. The repayment rate for loans maturing in 2016 averaged 86 percent this year, but as credit conditions tighten and underlying real estate fundamentals decelerate, only about two-thirds of loans originated in 2007 are expected to repay.
Recession Forecasting
How Will We Know if the Sun Is Setting on Growth?
Many analysts and prognosticators have recognized that the length of the current business cycle, at 90 months in December, has surpassed the average length of expansion for the prior business cycles, which in the post-war era is 58.4 months. We admit that business cycles do not die of old age but rather end due to unforecastable shocks. Thus, when trying to disentangle where these shocks will emerge, we have to examine risks to growth from both the credit cycle as well as risks to real macroeconomic growth fundamentals. As we look ahead to 2017, our focus has begun to turn from the drivers of economic growth to potential downside risks to our baseline forecast presented in the U.S. Outlook section on page 3. In order to narrow the focus on the potential risks, we use a number of tools and specific measures that help guide our thinking about macroeconomic risk in the year ahead.
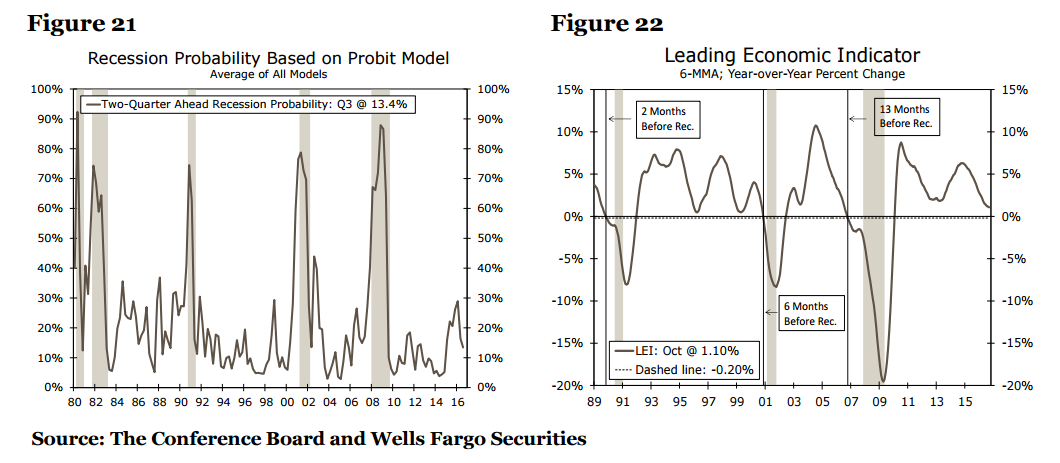
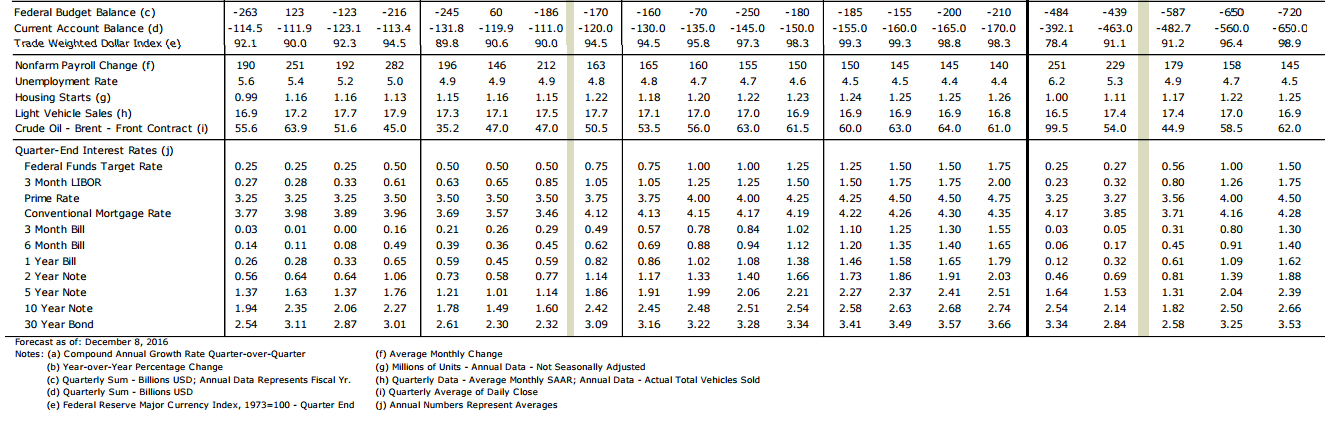
When we examine the credit market data, there are a number of key sources that have been shown to provide insight into potential credit imbalances from a macro perspective including the Senior Loan Officer Opinion Survey, the FDIC’s Quarterly Banking Profile and the shape of the yield curve. The Senior Loan Officer Opinion Survey can provide early indications of potential concerns by examining the percentage of banks tightening lending activity. As of Q3 2016, the survey indicated that banks were tightening standards for commercial and industrial (C&I) loans to all sizes of firms as well as for residential and non-residential commercial real estate (Figure 19). The FDIC Banking Survey then begins to fill in some of the reasons for the tighter standards, as the number of noncurrent C&I loans began to rise from 0.5 percent in Q1 of 2015 to 1.3 percent as of Q3 of 2016 (Figure 20). Taken together, the tighter credit conditions along with rising noncurrent loans suggest that there could be downside risk to our outlook for business fixed investment in 2017.
Another closely watched measure in the credit cycle, often cited as a useful tool for forecasting recessions one-year ahead, is a recession probability model based on the spread between the 10-year U.S. Treasury yield and the 3-month U.S. Treasury yield.5 According to the New York Federal Reserve’s latest update using the yield spread, the probability of a recession twelve months from now stands at 7.56 percent. While this measure has been shown to be a useful measure in the past, the unique combination of very low short-term interest rates near the zero bound and the difficulty of long-term interest rates going too far into negative territory due to portfolio constraints of institutional investors may mean that the curve may not invert when it could or should.6 Thus, there is a growing consensus that the traditional yield curve spread recession probability model may be less effective in detecting a downturn over the next year.
Our official recession probability model utilizes the Conference Board’s Leading Economic Index (LEI), the S&P 500 index and the Chicago-PMI employment index as predictors and gives us a six month lead time. Our model has served us well, as it started predicting (in real-time) a significantly higher probability of recession in 2007 (58 percent probability in Q3 2007). Our latest update, which includ es data through November, indicates a less than 10 percent probability of a recession six months from now. Instead of relying on a single model, we also average our entire set of recession probability models which has successfully predicted every recession since 1980. The range of our six-month ahead recession prediction models spans from less than 10 percent to a high of 26.5 percent probability for a recession. The current average of all models stands at 13.4 percent, well short of our 50 percent benchmark for us to become concerned (Figure 21).
In order to get a longer lead-time of 12-months ahead in our recession prediction, we took the 6-month moving average of the yearly change in the LEI (Figure 22). Our analysis shows that anytime the 6-month moving average of LEI falls below -0.2 percent in any month, a recession has begun between 12 and 15 months later. Currently the 6-month moving average of the index stands at positive 1.10 percent signaling modest growth but not likely a recession over the course of 2017.
Thus we do not see any statistical evidence at this point to suggest that a recession is likely over the course of 2017. That said, there are some concerning signs that risks may be building, particularly related to C&I lending and commercial real estate throughout the course of 2017. Given these building risks within the business lending environment over the next year, there could be a potential for business investment to downshift as the year progresses. We will also continue to monitor key consumer sector indicators in the months ahead given that consumer spending remains the primary support to GDP growth in our outlook. Any spike in inflation, job layoffs or an equity market sell-off could send consumers into a cautious stance and thus the potential for a dramatic slowing of the U.S. economy could materialize over our forecast horizon. While we still see more upside risks to growth than downside in the year ahead, particularly if fiscal policy becomes more expansionary, it is important to note that downside risks to our outlook are still present.


20161208