
Top 100 Best STEM High Schools – Troy High School – US News & World Report – 3/100
Top 100 Best STEM High Schools – Troy High School – US News & World Report – 3/100
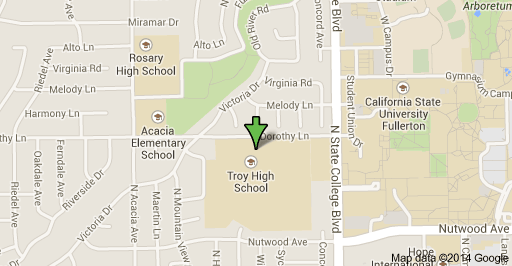
Troy High School
2200 EAST DOROTHY LN
FULLERTON, CA 92831
Phone: (714) 626-4401
District: Fullerton Joint Union High
Local Map
Overview
Troy High School is ranked 35th within California. Students have the opportunity to take Advanced Placement® course work and exams. The AP® participation rate at Troy High School is 62 percent. The student body makeup is 53 percent male and 47 percent female, and the total minority enrollment is 73 percent. Troy High School is 1 of 8 high schools in the Fullerton Joint Union High.
Rankings / Awards
This details how this school compares to others based on U.S. News ranking criteria.
Medal Awarded Gold
National Rank: #209
State Rank: #35
Magnet Rank: #56
STEM Rank: #3
Students / Teachers
These counts and percentages of students and teachers are from data reported by schools to the government.
Total Enrollment 2,565
Total Minority Enrollment (% of total) 73%
Total Economically Disadvantaged (% of total) 16%
Full-Time Teachers N/A
More About Student Body
Test Scores
U.S. News calculates these values based on student performance on state exit exams and internationally available exams on college-level coursework (AP®/IB exams).
Academic Performance Index Evaluation Achieves CA goal
College Readiness Index 59.9
School Data
School profile information is based on government data.
Grades Served 08 – 12
Setting Mid-size City
Charter School No
Magnet School Yes
Receives Title I Funding No
District
This information relates to high schools run by this school’s state operating agency. Many districts contain only one high school.
Total Schools 8
Total Students 14,710
Academic Performance Index Evaluation Does not achieve CA goal
College Readiness (district average) 37.1
Class
These details on the school’s student body are based on data reported to the government.
Total Enrollment 2,565
9th Grade 741 Students
10th Grade 593 Students
11th Grade 625 Students
12th Grade 606 Students
Student Diversity
This is the breakdown of ethnicity and gender of a school’s student body, based on data reported to the government.
Ethnicity/Race
Total Minority Enrollment (% of total) 73%
American Indian/Alaskan Native Enrollment (% of total) 0.2%
Asian Enrollment (% of total) 45%
Black Enrollment (% of total) 1%
Hawaiian Native/Pacific Islander (% of total) 0.2%
Hispanic Enrollment (% of total) 23%
White Enrollment (% of total) 27%
Two or More Races Enrollment (% of total) 4%
Gender
Male (% of total) 53%
Female (% of total) 47%
Economically Disadvantaged Students
These are the percentages of the school’s students eligible for free or reduced-price lunch, based on data reported to the government.
Free Lunch Program (% of total) 12%
Reduced-Price Lunch Program (% of total) 4%
Total Economically Disadvantaged (% of total) 16%
Source: US News & World Report