Top 100 Best STEM High Schools – Lynbrook High School – US News & World Report – 5/100
Top 100 Best STEM High Schools – Lynbrook High School – US News & World Report – 5/100
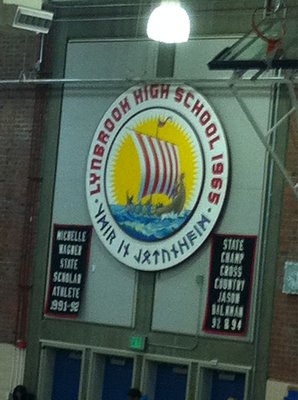
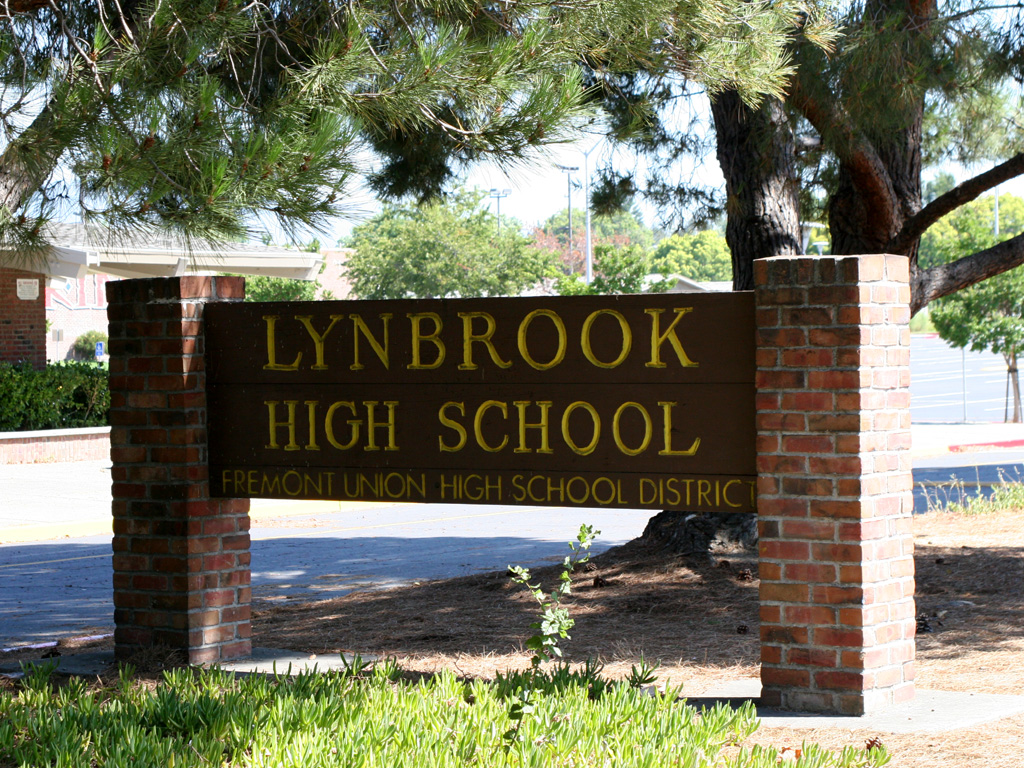
Lynbrook High School
1280 JOHNSON AVE
SAN JOSE, CA 95129
Phone: (408) 366-7700
District: Fremont Union High
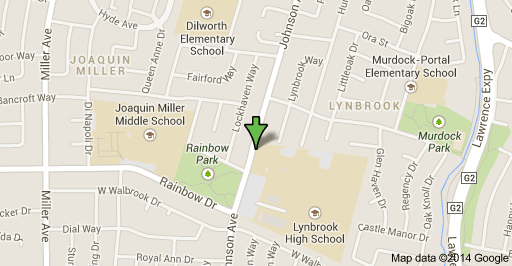
Local Map
Overview
Lynbrook High School is ranked 19th within California. Students have the opportunity to take Advanced Placement® course work and exams. The AP® participation rate at Lynbrook High School is 71 percent. The student body makeup is 51 percent male and 49 percent female, and the total minority enrollment is 85 percent. Lynbrook High School is 1 of 5 high schools in the Fremont Union High.
Rankings / Awards
This details how this school compares to others based on U.S. News ranking criteria.
Medal Awarded Gold
National Rank: #136
State Rank: #19
STEM Rank: #5
Students / Teachers
These counts and percentages of students and teachers are from data reported by schools to the government.
Total Enrollment 1,774
Total Minority Enrollment (% of total) 85%
Total Economically Disadvantaged (% of total) 4%
Full-Time Teachers N/A
Test Scores
U.S. News calculates these values based on student performance on state exit exams and internationally available exams on college-level coursework (AP®/IB exams).
Academic Performance Index Evaluation Achieves CA goal
College Readiness Index 69.0
School Data
School profile information is based on government data.
Grades Served 09 – 12
Setting Large City
Charter School No
Magnet School No
Receives Title I Funding No
District
This information relates to high schools run by this school’s state operating agency. Many districts contain only one high school.
Total Schools 5
Total Students 10,368
Academic Performance Index Evaluation Achieves CA goal
College Readiness (district average) 54.3
Student Body
Class
These details on the school’s student body are based on data reported to the government.
Total Enrollment 1,774
9th Grade 443 Students
10th Grade 443 Students
11th Grade 419 Students
12th Grade 463 Students
Student Diversity
This is the breakdown of ethnicity and gender of a school’s student body, based on data reported to the government.
Ethnicity/Race
Total Minority Enrollment (% of total) 85%
American Indian/Alaskan Native Enrollment (% of total) 0.2%
Asian Enrollment (% of total) 80%
Black Enrollment (% of total) 1%
Hawaiian Native/Pacific Islander (% of total) 0.2%
Hispanic Enrollment (% of total) 3%
White Enrollment (% of total) 15%
Two or More Races Enrollment (% of total) 0.3%
Gender
Male (% of total) 51%
Female (% of total) 49%
Economically Disadvantaged Students
These are the percentages of the school’s students eligible for free or reduced-price lunch, based on data reported to the government.
Free Lunch Program (% of total) 3%
Reduced-Price Lunch Program (% of total) 1%
Total Economically Disadvantaged (% of total) 4%
Test Scores
Academic Performance Index
Academic Performance Index is based on California High School Exit Examination and Standardized Testing and Reporting results.
Total Students Tested 1,269
Academic Performance Index 943
Overall Student Performance
This measures overall student performance on state exams. The calculations by U.S. News were the first of two steps in determining which schools received at least a bronze medal.
State Test Performance Index 943.0
Risk-Adjusted Performance Index 176.8
Disadvantaged Student Performance
This measures the proficiency on state exams among typically underperforming subgroups. The calculations by U.S. News were the second of two steps in determining which schools received at least a bronze medal.
Percentage of Disadvantaged Students Who Are Proficient 746.8
Percentage of Non-Disadvantaged Students Who Are Proficient 901.0
Gap Between Disadvantaged and Non-Disadvantaged Students -154.2
Gap Between School and State Among Disadvantaged Students 49.8
College-Ready Student Performance
High school students take AP® and IB exams to earn college credit and demonstrate success at college-level course work. U.S. News calculated a College Readiness Index based on exam participation rates and percentages of students passing at least one exam. The Index determined which types of medals (gold, silver or bronze) were awarded to top-performing schools.
College Readiness Index 69.0
Exam Used for Index AP®
Advanced Placement® (AP®) Student Performance
Many U.S. higher educational institutions grant credits or advanced placement based on student performance on AP® exams. This shows this school’s student participation and performance on these exams if data were available. (N/A means no students participated.)
Participation Rate 71%
Participant Passing Rate 96%
Exams Per Test Taker 4.4
Exam Pass Rate 91%
Quality-Adjusted Participation Rate 68%
Quality-Adjusted Exams Per Test Taker 4.1
” I’ll let this schools reputation speak for itself, but this campus needs a face lift. Considering the tax revenue this area generates, I’m surprised that the school looks like it hasn’t been updated since my boyfriend went here 20 years ago. Campus is a confusing mix of outdated buildings surrounding a large open courtyard, accented by gross and dingy bathrooms, a smallish library, and two measles cafeteria lines.
Clearly the nicest building here is the admin offices, us no one is surprised by that, I’m sure. I will say that the classroom interiors are a little better than expected, and ones I’ve been in reflect dedicated and talented teachers, particularly in the languages. The campus is covered in flyers and posters advertising various club and group meetings, and it appears the student body is pretty active in terms of extracurricular options to pad their college applications with.
One thing I really don’t get though, and this is several campuses. To just this one, is the covered parking for students. Can’t we spend that money on educational supplies? At the very least, I hope they’re covered with solar panels on top, but judging by the dated look of the auditorium tech, I seriously doubt it. I have seen very few computers or other technology on this campus, though I have yet to find the science lab(s).” – Stefany V.
Source: US News & World Report