Rowland Heights, Los Angeles County, CA 91748
Rowland Heights, Los Angeles County, CA 91748
Estimated ZIP code Population in 2011: 47,076
Zip code Population in 2010: 45,406
Zip code Population in 2000: 46,324
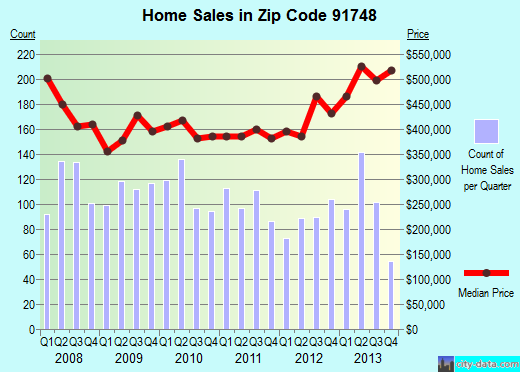
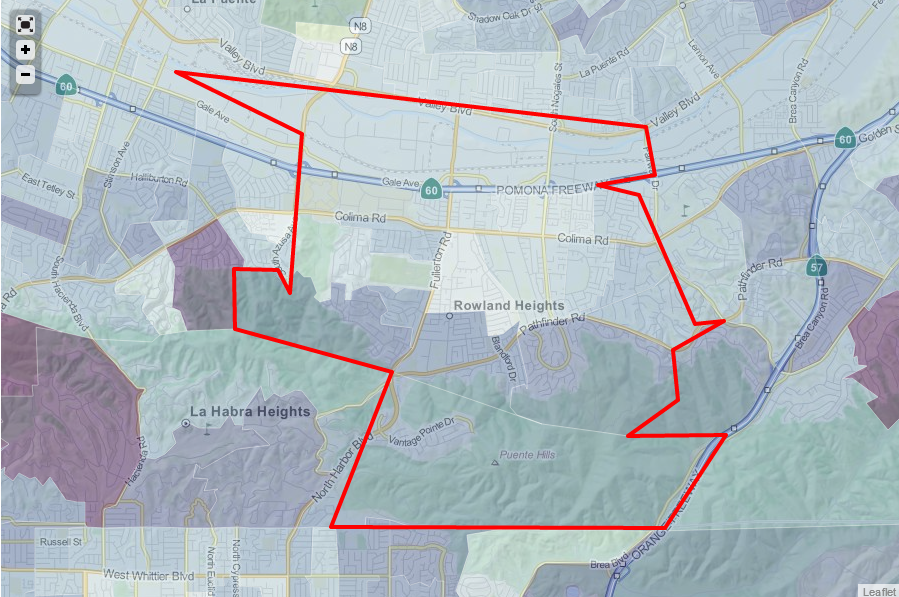
Recent home sales, real estate maps, and home value estimator for zip code 91748
Houses and Condos: 14,335
Renter-Occupied apartments: 4,789
| % Of renters here: | 36% |
| State: | 45% |
Mar 2012 cost of living index in zip code 91748:. 130.9 (high, US average is 100)
Land Area: 14.5 sq. mi..
Water Area:. 0.1 sq. mi.
| Population density: 3,254 people per square mile |
|
(Average). |
Real estate property taxes paid for housing units in 2011:
| This zip code: | 0.7% ($ 3,674) |
| California: | 0.8% ($ 2,907) |
Median Real Estate property Taxes paid for Housing Units with Mortgages in 2011: $ 3,979 (0.8%)
Median Real Estate Taxes paid for property with no Mortgage Housing Units in 2011: $ 2,675 (0.6%)
| Males: 23,402 | |
| Females: 23,674 |
For population 25 years and over in 91748:
- High school or higher: 85.1%
- Bachelor’s degree or higher: 36.6%
- Graduate or professional degree: 8.5%
- Unemployed: 6.1%
- Mean travel time to work (commute): 31.2 minutes
For population 15 years and over in 91748:
- Never married: 32.2%
- Now married: 54.3%
- Separated: 1.4%
- Widowed: 4.6%
- Divorced: 7.5%
Zip code 91748 compared to state average:
- Black race population percentage significantly below state average.
- Median age above state average.
- Foreign-born population percentage above state average.
Neighborhoods in zip code 91748:
Percentage of zip code residents living and working in this county: 82.9%
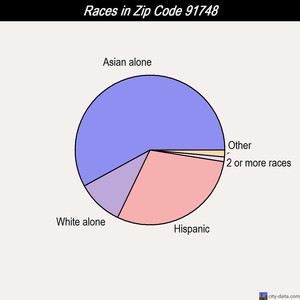
Races in zip code 91748:
White Population: 4,404
Black Population: 599
American Indian Population: 41
Asian Population: 27,006
Native Hawaiian and Other Pacific Islander Population: 56
Some Other Race Population: 24
Two or More Races Population: 697
Hispanic or Latino Population: 12,579