
Rent trend data in San Jose, California
San Jose Average Rent
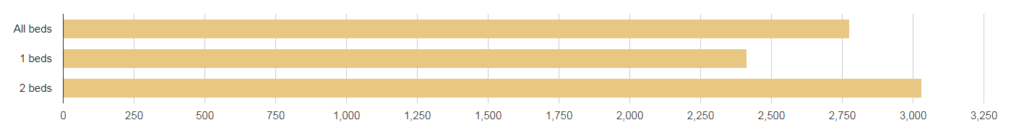
As of December 2020, average rent for an apartment in San Jose, CA is $2775 which is a 9.44% decrease from last year when the average rent was $3037 , and a 1.01% increase from last month when the average rent was $2747.
One bedroom apartments in San Jose rent for $2412 a month on average (a 11.61% decrease from last year) and two bedroom apartment rents average $3031 (a 8.51% decrease from last year).
San Jose Rent Trends
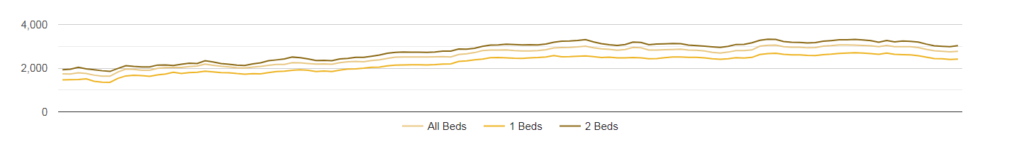
The average apartment rent over the prior 6 months in San Jose has decreased by $170 (-5.8%)
One bedroom units have decreased by $156 (-6.1%) and two bedroom apartments have decreased by $166 (-5.2%)
| Month | All Beds | 1 Beds | 2 Beds |
|---|---|---|---|
| 1/2011 | 1,742 | 1,467 | 1,926 |
| 2/2011 | 1,733 | 1,470 | 1,951 |
| 3/2011 | 1,786 | 1,480 | 2,038 |
| 4/2011 | 1,758 | 1,513 | 1,969 |
| 5/2011 | 1,679 | 1,397 | 1,924 |
| 6/2011 | 1,633 | 1,354 | 1,882 |
| 7/2011 | 1,633 | 1,351 | 1,851 |
| 8/2011 | 1,825 | 1,534 | 1,987 |
| 9/2011 | 1,959 | 1,646 | 2,116 |
| 10/2011 | 1,940 | 1,671 | 2,079 |
| 11/2011 | 1,905 | 1,655 | 2,053 |
| 12/2011 | 1,902 | 1,630 | 2,055 |
| 1/2012 | 1,989 | 1,688 | 2,142 |
| 2/2012 | 2,022 | 1,735 | 2,146 |
| 3/2012 | 2,036 | 1,814 | 2,121 |
| 4/2012 | 2,029 | 1,758 | 2,181 |
| 5/2012 | 2,074 | 1,799 | 2,224 |
| 6/2012 | 2,101 | 1,813 | 2,211 |
| 7/2012 | 2,184 | 1,864 | 2,340 |
| 8/2012 | 2,132 | 1,832 | 2,285 |
| 9/2012 | 2,086 | 1,797 | 2,212 |
| 10/2012 | 2,055 | 1,792 | 2,177 |
| 11/2012 | 2,020 | 1,753 | 2,142 |
| 12/2012 | 2,006 | 1,723 | 2,126 |
| 1/2013 | 2,052 | 1,745 | 2,192 |
| 2/2013 | 2,078 | 1,742 | 2,244 |
| 3/2013 | 2,130 | 1,796 | 2,338 |
| 4/2013 | 2,167 | 1,847 | 2,378 |
| 5/2013 | 2,173 | 1,865 | 2,420 |
| 6/2013 | 2,252 | 1,900 | 2,508 |
| 7/2013 | 2,242 | 1,923 | 2,476 |
| 8/2013 | 2,213 | 1,902 | 2,421 |
| 9/2013 | 2,189 | 1,844 | 2,351 |
| 10/2013 | 2,193 | 1,870 | 2,355 |
| 11/2013 | 2,179 | 1,843 | 2,341 |
| 12/2013 | 2,254 | 1,910 | 2,422 |
| 1/2014 | 2,289 | 1,962 | 2,450 |
| 2/2014 | 2,311 | 1,970 | 2,493 |
| 3/2014 | 2,296 | 1,997 | 2,499 |
| 4/2014 | 2,352 | 2,044 | 2,548 |
| 5/2014 | 2,379 | 2,047 | 2,601 |
| 6/2014 | 2,449 | 2,102 | 2,686 |
| 7/2014 | 2,503 | 2,139 | 2,726 |
| 8/2014 | 2,512 | 2,146 | 2,737 |
| 9/2014 | 2,511 | 2,157 | 2,730 |
| 10/2014 | 2,513 | 2,156 | 2,735 |
| 11/2014 | 2,515 | 2,146 | 2,726 |
| 12/2014 | 2,517 | 2,159 | 2,738 |
| 1/2015 | 2,525 | 2,188 | 2,778 |
| 2/2015 | 2,510 | 2,195 | 2,784 |
| 3/2015 | 2,628 | 2,306 | 2,880 |
| 4/2015 | 2,656 | 2,330 | 2,873 |
| 5/2015 | 2,712 | 2,379 | 2,910 |
| 6/2015 | 2,807 | 2,418 | 3,003 |
| 7/2015 | 2,826 | 2,479 | 3,058 |
| 8/2015 | 2,830 | 2,485 | 3,066 |
| 9/2015 | 2,836 | 2,475 | 3,101 |
| 10/2015 | 2,806 | 2,455 | 3,081 |
| 11/2015 | 2,786 | 2,449 | 3,062 |
| 12/2015 | 2,791 | 2,469 | 3,073 |
| 1/2016 | 2,806 | 2,486 | 3,065 |
| 2/2016 | 2,844 | 2,514 | 3,105 |
| 3/2016 | 2,928 | 2,575 | 3,190 |
| 4/2016 | 2,946 | 2,523 | 3,237 |
| 5/2016 | 2,948 | 2,530 | 3,247 |
| 6/2016 | 2,972 | 2,548 | 3,267 |
| 7/2016 | 3,005 | 2,563 | 3,306 |
| 8/2016 | 2,936 | 2,527 | 3,205 |
| 9/2016 | 2,883 | 2,490 | 3,122 |
| 10/2016 | 2,862 | 2,504 | 3,075 |
| 11/2016 | 2,822 | 2,473 | 3,042 |
| 12/2016 | 2,851 | 2,471 | 3,079 |
| 1/2017 | 2,954 | 2,487 | 3,193 |
| 2/2017 | 2,936 | 2,473 | 3,178 |
| 3/2017 | 2,830 | 2,432 | 3,077 |
| 4/2017 | 2,830 | 2,442 | 3,103 |
| 5/2017 | 2,842 | 2,477 | 3,115 |
| 6/2017 | 2,853 | 2,509 | 3,132 |
| 7/2017 | 2,868 | 2,514 | 3,123 |
| 8/2017 | 2,830 | 2,495 | 3,060 |
| 9/2017 | 2,818 | 2,495 | 3,032 |
| 10/2017 | 2,786 | 2,475 | 3,005 |
| 11/2017 | 2,726 | 2,430 | 2,976 |
| 12/2017 | 2,695 | 2,405 | 2,952 |
| 1/2018 | 2,736 | 2,432 | 2,999 |
| 2/2018 | 2,804 | 2,479 | 3,085 |
| 3/2018 | 2,801 | 2,466 | 3,093 |
| 4/2018 | 2,836 | 2,493 | 3,161 |
| 5/2018 | 3,005 | 2,623 | 3,278 |
| 6/2018 | 3,050 | 2,666 | 3,325 |
| 7/2018 | 3,057 | 2,685 | 3,320 |
| 8/2018 | 2,984 | 2,635 | 3,222 |
| 9/2018 | 2,962 | 2,613 | 3,190 |
| 10/2018 | 2,963 | 2,611 | 3,180 |
| 11/2018 | 2,931 | 2,584 | 3,154 |
| 12/2018 | 2,941 | 2,579 | 3,168 |
| 1/2019 | 3,005 | 2,616 | 3,232 |
| 2/2019 | 3,029 | 2,639 | 3,263 |
| 3/2019 | 3,065 | 2,672 | 3,297 |
| 4/2019 | 3,064 | 2,693 | 3,301 |
| 10/2019 | 3,054 | 2,707 | 3,314 |
| 11/2019 | 3,037 | 2,692 | 3,289 |
| 12/2019 | 3,028 | 2,667 | 3,260 |
| 1/2020 | 2,981 | 2,635 | 3,189 |
| 3/2020 | 3,044 | 2,687 | 3,271 |
| 4/2020 | 2,985 | 2,632 | 3,206 |
| 5/2020 | 2,985 | 2,619 | 3,241 |
| 6/2020 | 2,980 | 2,613 | 3,229 |
| 7/2020 | 2,945 | 2,568 | 3,197 |
| 8/2020 | 2,861 | 2,502 | 3,101 |
| 9/2020 | 2,796 | 2,439 | 3,027 |
| 10/2020 | 2,772 | 2,427 | 3,003 |
| 11/2020 | 2,747 | 2,401 | 2,984 |
| 12/2020 | 2,775 | 2,412 | 3,031 |
San Jose Average Rent By Neighborhood
DowntownBuena VistaNorth San JoseBlossom ValleyNorth ValleyWest San JoseWillow GlenCambrian ParkFairgroundsEast San JoseEvergreenEdenvale-Seven TreesBerryessa
| Neighborhood | Rent |
|---|---|
| Downtown | 2,841 |
| Buena Vista | 2,746 |
| North San Jose | 2,696 |
| Blossom Valley | 2,629 |
| North Valley | 2,538 |
| West San Jose | 2,444 |
| Willow Glen | 2,388 |
| Cambrian Park | 2,384 |
| Fairgrounds | 2,381 |
| East San Jose | 2,246 |
| Evergreen | 2,139 |
| Edenvale-Seven Trees | 2,089 |
| Berryessa | 2,062 |
The most expensive San Jose neighborhoods to rent apartments in are Downtown, Buena Vista, and North San Jose.
The cheapest San Jose neignborhoods to rent apartments in are Berryessa, Edenvale-Seven Trees, and Evergreen.
For more info, please check:https://www.rentjungle.com/average-rent-in-san-jose-rent-trends/