Top 100 Best STEM High Schools – Leland High School – US News & World Report – 26/100
Top 100 Best STEM Schools – US News & World Report – 26/100

Leland High School
Leland High School
6677 CAMDEN AVE
SAN JOSE, CA 95120
Phone: (408) 535-6290
District: San Jose Unified School District
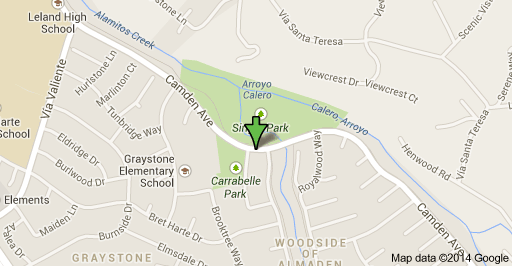
Local Map
Leland High School
6677 CAMDEN AVE
SAN JOSE, CA 95120
Phone: (408) 535-6290
District: San Jose Unified School District
Overview
Leland High School is ranked 53rd within California. Students have the opportunity to take Advanced Placement® course work and exams. The AP® participation rate at Leland High School is 58 percent. The student body makeup is 53 percent male and 47 percent female, and the total minority enrollment is 57 percent. Leland High School is 1 of 12 high schools in the San Jose Unified School District.
Rankings / Awards
This details how this school compares to others based on U.S. News ranking criteria.
Medal Awarded Gold
National Rank
#305
State Rank
#53
STEM Rank
#26
See Best High Schools in California
Students / Teachers
These counts and percentages of students and teachers are from data reported by schools to the government.
Total Enrollment 1,795
Total Minority Enrollment (% of total) 57%
Total Economically Disadvantaged (% of total) 8%
Full-Time Teachers N/A
More About Student Body
Test Scores
U.S. News calculates these values based on student performance on state exit exams and internationally available exams on college-level coursework (AP®/IB exams).
Academic Performance Index Evaluation Achieves CA goal
College Readiness Index 53.7
More about Test Scores
School Data
School profile information is based on government data.
Grades Served 09 – 12
Setting Large City
Charter School No
Magnet School No
Receives Title I Funding No
District
This information relates to high schools run by this school’s state operating agency. Many districts contain only one high school.
Total Schools 12
Total Students 10,039
Academic Performance Index Evaluation Does not achieve CA goal
College Readiness (district average) 36.1
Total Enrollment 1,795
9th Grade 459 Students
10th Grade 468 Students
11th Grade 447 Students
12th Grade 421 Students
Student Diversity
This is the breakdown of ethnicity and gender of a school’s student body, based on data reported to the government.
Ethnicity/Race
Total Minority Enrollment (% of total) 57%
American Indian/Alaskan Native Enrollment (% of total) 1%
Asian Enrollment (% of total) 42%
Black Enrollment (% of total) 1%
Hawaiian Native/Pacific Islander (% of total) 0.3%
Hispanic Enrollment (% of total) 12%
White Enrollment (% of total) 43%
Two or More Races Enrollment (% of total) 1%
Gender
Male (% of total) 53%
Female (% of total) 47%
Economically Disadvantaged Students
These are the percentages of the school’s students eligible for free or reduced-price lunch, based on data reported to the government.
Free Lunch Program (% of total) 6%
Reduced-Price Lunch Program (% of total) 2%
Total Economically Disadvantaged (% of total) 8%
Test Scores
Academic Performance Index
Academic Performance Index is based on California High School Exit Examination and Standardized Testing and Reporting results.
Total Students Tested 1,342
Academic Performance Index 893
Overall Student Performance
This measures overall student performance on state exams. The calculations by U.S. News were the first of two steps in determining which schools received at least a bronze medal.
State Test Performance Index 893.0
Risk-Adjusted Performance Index 133.4
Disadvantaged Student Performance
This measures the proficiency on state exams among typically underperforming subgroups. The calculations by U.S. News were the second of two steps in determining which schools received at least a bronze medal.
Percentage of Disadvantaged Students Who Are Proficient 751.4
Percentage of Non-Disadvantaged Students Who Are Proficient 872.0
Gap Between Disadvantaged and Non-Disadvantaged Students -120.6
Gap Between School and State Among Disadvantaged Students 54.4
College-Ready Student Performance
High school students take AP® and IB exams to earn college credit and demonstrate success at college-level course work. U.S. News calculated a College Readiness Index based on exam participation rates and percentages of students passing at least one exam. The Index determined which types of medals (gold, silver or bronze) were awarded to top-performing schools.
College Readiness Index 53.7
Exam Used for Index AP®
Advanced Placement® (AP®) Student Performance
Many U.S. higher educational institutions grant credits or advanced placement based on student performance on AP® exams. This shows this school’s student participation and performance on these exams if data were available. (N/A means no students participated.)
Participation Rate 58%
Participant Passing Rate 90%
Exams Per Test Taker 3.6
Exam Pass Rate 89%
Quality-Adjusted Participation Rate 52%
Quality-Adjusted Exams Per Test Taker 3.5
Leland High School is a public high school located in the Almaden Valley in San Jose, California, USA in the San Jose Unified School District. Leland is well known for its nationally ranked Speech and Debate team (as of 1999 – May 2012).