
Milpitas, Santa Clara County, CA 95035
Milpitas, Santa Clara County, CA 95035
Estimated zip code population in 2011: 66,437
Zip code population in 2010: 66,943
Zip code population in 2000: 62,840
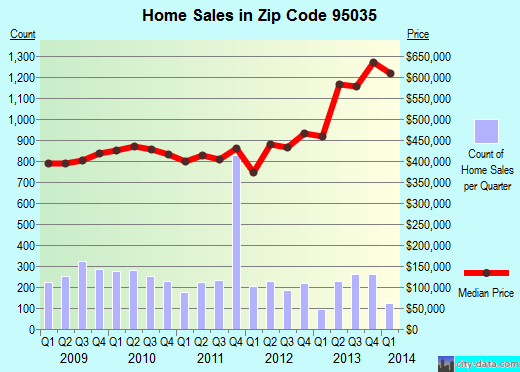
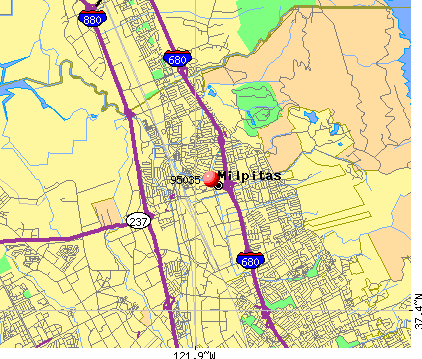
Recent home sales, real estate maps, and home value estimator for zip code 95035
Houses and condos: 20,058
Renter-occupied apartments: 6,280
| % of renters here: |
33% |
| State: |
45% |
Mar. 2012 cost of living index in zip code 95035: 135.0 (high, U.S. average is 100)
Land area: 23.2 sq. mi.
Water area: 0.1 sq. mi.
| Population density: 2,858 people per square mile |
|
(average). |
Real estate property taxes paid for housing units in 2011:
| This zip code: |
0.7% ($4,213) |
| California: |
0.8% ($2,907) |
Median real estate property taxes paid for housing units with mortgages in 2011: $4,529 (0.8%)
Median real estate property taxes paid for housing units with no mortgage in 2011: $2,612 (0.5%)
| Males: 34,251 | |
| Females: 32,186 |
For population 25 years and over in 95035:
- High school or higher: 87.1%
- Bachelor’s degree or higher: 39.3%
- Graduate or professional degree: 13.3%
- Unemployed: 7.4%
- Mean travel time to work (commute): 21.9 minutes
For population 15 years and over in 95035:
- Never married: 30.3%
- Now married: 56.1%
- Separated: 1.9%
- Widowed: 4.6%
- Divorced: 7.1%
Zip code 95035 compared to state average:
- Median household income above state average.
- Black race population percentage below state average.
- Hispanic race population percentage below state average.
- Foreign-born population percentage above state average.
- House age below state average.

Percentage of zip code residents living and working in this county: 79.8%
Races in zip code 95035:
White population: 9,838
Black population: 1,837
American Indian population: 141
Asian population: 41,342
Native Hawaiian and Other Pacific Islander population: 317
Some other race population: 93
Two or more races population: 2,111
Hispanic or Latino population: 11,264