CNN Fear and Greed Index Reaches 2017 Highs
CNN’s Fear and Greed index have soared to levels not seen since 2017, indicating that US stock market investors and traders will do better to wait for a correction before buying stocks.
The Fear and Greed index takes six different stock market gauges and combines them to one measure to better understand and quantify the mood of investors. It helps to know when markets are oversold, and also when they are overbought.
The indicator is good in hinting when market bottoms are near, and we provided an update last month when it was hinting a low was near. Since then, the S&P 500 index has risen by 6.72%, while the drawdown over the period was just 0.44%.
My research and usage of the indicator tell me that it is less good at predicting market tops. However, the speed of the last few week’s gains in the S&P 500 and the sharp rise in the Fear and Greed index are hard to ignore.
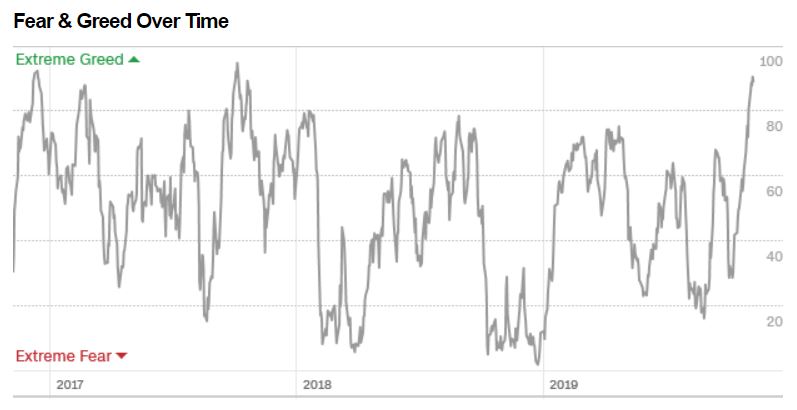
Source: CNN.com
It is also interesting to note how the AAII bear sentiment index had reached the same low levels as we saw in summer before the S&P 500 dropped by 8.83%. It is also nearing the same low levels as when the index declined by 7.78% in May.
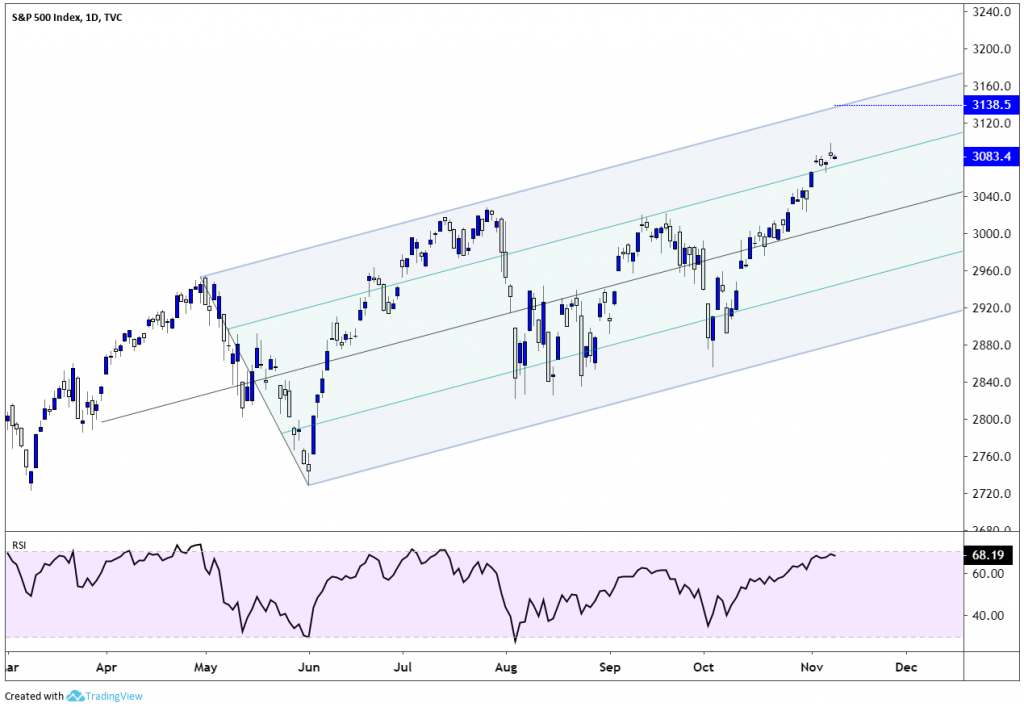
Technically, the S&P 500 is overbought per the RSI 14 on the daily chart, as seen in the lower panel below. Yet if we use an “Andrew’s Pitchfork” to measure the level of overbought, we can see that the index cleared the trendline that was limiting the price in September, and could now be on its way to the next resistance trendline at 3138.5. To reject the bullish momentum the S&P 500 would need to trade below the November 6 low of 3066.
S&P 500 Daily Chart