Top 100 Best STEM High Schools – Lexington High School – US News & World Report – 24/100
Top 100 Best STEM Schools – US News & World Report – 24/100
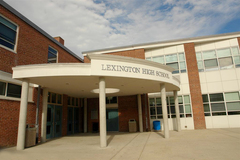
Lexington High School
251 WALTHAM ST
LEXINGTON, MA 02421
Phone: (781) 861-2320
District: Lexington
Overview
Lexington High School is ranked 11th within Massachusetts. Students have the opportunity to take Advanced Placement® course work and exams. The AP® participation rate at Lexington High School is 63 percent. The student body makeup is 48 percent male and 52 percent female, and the total minority enrollment is 37 percent. Lexington High School is the only high school in the Lexington.
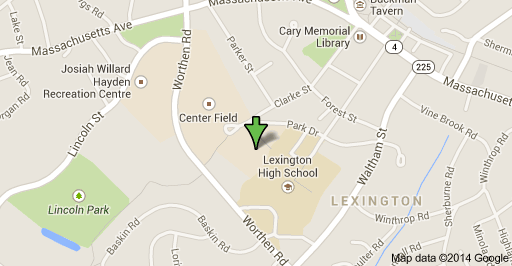
Local Map
Rankings / Awards
This details how this school compares to others based on U.S. News ranking criteria.
Medal Awarded Gold
National Rank
#204
State Rank
#11
STEM Rank
#24
See Best High Schools in Massachusetts
Students / Teachers
These counts and percentages of students and teachers are from data reported by schools to the government.
Total Enrollment 1,983
Total Minority Enrollment (% of total) 37%
Total Economically Disadvantaged (% of total) 6%
Full-Time Teachers 156
More About Student Body
Test Scores
U.S. News calculates these values based on student performance on state exit exams and internationally available exams on college-level course work (AP®/IB exams).
Proficient in English 100%
Proficient in Math 97%
College Readiness Index 60.5
More About Test Scores
School Data
School profile information is based on government data.
Grades Served 09 – 12
Setting Large Suburb
Charter School No
Magnet School No
Receives Title I Funding No
District
This information relates to high schools run by this school’s state operating agency. Many districts contain only one high school.
Total Schools 1
Total Students 1,983
Proficient in English (district average) 100%
Proficient in Math (district average) 97%
College Readiness (district average) 60.5
Total Enrollment 1,983
9th Grade 482 Students
10th Grade 510 Students
11th Grade 501 Students
12th Grade 490 Students
Student Diversity
This is the breakdown of ethnicity and gender of a school’s student body, based on data reported to the government.
Ethnicity/Race
Total Minority Enrollment (% of total) 37%
American Indian/Alaskan Native Enrollment (% of total) 0.1%
Asian Enrollment (% of total) 26%
Black Enrollment (% of total) 5%
Hawaiian Native/Pacific Islander (% of total) 0%
Hispanic Enrollment (% of total) 4%
White Enrollment (% of total) 63%
Two or More Races Enrollment (% of total) 3%
Gender
Male (% of total) 48%
Female (% of total) 52%
Economically Disadvantaged Students
These are the percentages of the school’s students eligible for free or reduced-price lunch, based on data reported to the government.
Free Lunch Program (% of total) 5%
Reduced-Price Lunch Program (% of total) 1%
Total Economically Disadvantaged (% of total) 6%
English Proficiency Distribution
English proficiency is determined by student results on the school’s Massachusetts Comprehensive Assessment System test.
Total Students Tested 489
Failing 0%
Needs Improvement 0%
Proficient 24%
Advanced 76%
Math Proficiency Distribution
Math proficiency is determined by student results on the school’s Massachusetts Comprehensive Assessment System test.
Total Students Tested 494
Failing 0%
Needs Improvement 2%
Proficient 9%
Advanced 88%
Overall Student Performance
This measures overall student performance on state exams. The calculations by U.S. News were the first of two steps in determining which schools received at least a bronze medal.
State Test Performance Index 140.0
Risk-Adjusted Performance Index 15.4
Disadvantaged Student Performance
This measures the proficiency on state exams among typically underperforming subgroups. The calculations by U.S. News were the second of two steps in determining which schools received at least a bronze medal.
Percentage of Disadvantaged Students Who Are Proficient 89.7
Percentage of Non-Disadvantaged Students Who Are Proficient 99.0
Gap Between Disadvantaged and Non-Disadvantaged Students -9.3
Gap Between School and State Among Disadvantaged Students 26.6
College-Ready Student Performance
High school students take AP® and IB exams to earn college credit and demonstrate success at college-level course work. U.S. News calculated a College Readiness Index based on exam participation rates and percentages of students passing at least one exam. The Index determined which types of medals (gold, silver or bronze) were awarded to top-performing schools.
College Readiness Index 60.5
Exam Used for Index AP®
Advanced Placement® (AP®) Student Performance
Many U.S. higher educational institutions grant credits or advanced placement based on student performance on AP® exams. This shows this school’s student participation and performance on these exams if data were available. (N/A means no students participated.)
Participation Rate 63%
Participant Passing Rate 94%
Exams Per Test Taker 4.0
Exam Pass Rate 93%
Quality-Adjusted Participation Rate 60%
Quality-Adjusted Exams Per Test Taker 4.0
Comment/s
“Both my old hometown and my new hometown performed well! The discrepancy in acheivement runs parallel to the discrepancy in economic advantages; but it doesn’t have to be that way – the very top performers have many economically disadvantaged students. Interesting…”- Kristen Hanssen Goodell · Columbia University