Top 100 Best STEM High Schools – Northside College Preparatory High School – US News & World Report – 37/100
Top 100 Best STEM High Schools – Northside College Preparatory High School – US News & World Report – 37/100
Northside College Preparatory High School
Northside College Preparatory High School
5501 NORTH KEDZIE AVE
CHICAGO, IL 60625
Phone: (773) 534-3954
District: Chicago Public Schools
Overview
Northside College Preparatory High School’s curriculum focuses on in-depth study of topics such as physics, constitutional law, and technology. Computer science courses include Web design and advanced data structures. Students can also choose from six language programs and more than 50 clubs and extracurricular activities. Most classes at Northside College Preparatory High School are honors and Advanced Placement courses, and students can participate in study abroad programs to enhance their learning.
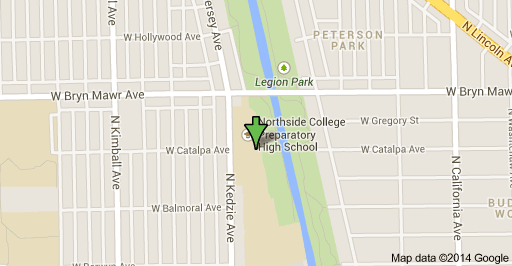
Local Map
Rankings / Awards
This details how this school compares to others based on U.S. News ranking criteria.
Medal Awarded Gold
National Rank
#33
State Rank
#1
Magnet Rank
#12
STEM Rank
#37
See Best High Schools in Illinois
Students / Teachers
These counts and percentages of students and teachers are from data reported by schools to the government.
Total Enrollment 1,088
Total Minority Enrollment (% of total) 60%
Total Economically Disadvantaged (% of total) 35%
Full-Time Teachers 66
More About Student Body
Test Scores
U.S. News calculates these values based on student performance on state exit exams and internationally available exams on college-level course work (AP®/IB exams).
Proficient in Reading 100%
Proficient in Math 100%
College Readiness Index 93.4
More About Test Scores
School Data
School profile information is based on government data.
Grades Served 09 – 12
Setting Large City
Charter School No
Magnet School Yes
Receives Title I Funding No
District
This information relates to high schools run by this school’s state operating agency. Many districts contain only one high school.
Total Schools 107
Total Students 95,704
Proficient in Reading (district average) 27%
Proficient in Math (district average) 23%
College Readiness (district average) 20.2
Total Enrollment 1,088
9th Grade 268 Students
10th Grade 261 Students
11th Grade 259 Students
12th Grade 300 Students
Student Diversity
This is the breakdown of ethnicity and gender of a school’s student body, based on data reported to the government.
Ethnicity/Race
Total Minority Enrollment (% of total) 60%
American Indian/Alaskan Native Enrollment (% of total) 1%
Asian Enrollment (% of total) 27%
Black Enrollment (% of total) 6%
Hawaiian Native/Pacific Islander (% of total) 0.5%
Hispanic Enrollment (% of total) 23%
White Enrollment (% of total) 40%
Two or More Races Enrollment (% of total) 3%
Gender
Male (% of total) 44%
Female (% of total) 56%
Economically Disadvantaged Students
These are the percentages of the school’s students eligible for free or reduced-price lunch, based on data reported to the government.
Free Lunch Program (% of total) 23%
Reduced-Price Lunch Program (% of total) 11%
Total Economically Disadvantaged (% of total) 35%
Reading Proficiency Distribution
Reading proficiency is determined by student results on the school’s Prairie State Achievement Examination.
Total Students Tested N/A
Academic Warning 0%
Below Standard 0%
Meets the Standard 36%
Exceeds the Standard 64%
Math Proficiency Distribution
Math proficiency is determined by student results on the school’s Prairie State Achievement Examination.
Total Students Tested N/A
Academic Warning 0%
Below Standard 0%
Meets the Standard 55%
Exceeds the Standard 45%
Overall Student Performance
This measures overall student performance on state exams. The calculations by U.S. News were the first of two steps in determining which schools received at least a bronze medal.
State Test Performance Index 127.3
Risk-Adjusted Performance Index 52.5
Disadvantaged Student Performance
This measures the proficiency on state exams among typically underperforming subgroups. The calculations by U.S. News were the second of two steps in determining which schools received at least a bronze medal.
Percentage of Disadvantaged Students Who Are Proficient 100.0
Percentage of Non-Disadvantaged Students Who Are Proficient 100.0
Gap Between Disadvantaged and Non-Disadvantaged Students 0.0
Gap Between School and State Among Disadvantaged Students 70.9
College-Ready Student Performance
High school students take AP® and IB exams to earn college credit and demonstrate success at college-level course work. U.S. News calculated a College Readiness Index based on exam participation rates and percentages of students passing at least one exam. The Index determined which types of medals (gold, silver or bronze) were awarded to top-performing schools.
College Readiness Index 93.4
Exam Used for Index AP®
Advanced Placement® (AP®) Student Performance
Many U.S. higher educational institutions grant credits or advanced placement based on student performance on AP® exams. This shows this school’s student participation and performance on these exams if data were available. (N/A means no students participated.)
Participation Rate 96%
Participant Passing Rate 97%
Exams Per Test Taker 5.0
Exam Pass Rate 87%
Quality-Adjusted Participation Rate 93%
Quality-Adjusted Exams Per Test Taker 4.5