These Are the 20 Richest Cities in America
These Are the 20 Richest Cities in America
November 5, 2015
The tech boom has shifted the balance of economic power
San Jose, San Francisco, Seattle: These cities house more than the headquarters of the world’s largest technology companies. They are also some of the most productive hubs in the U.S. economy.
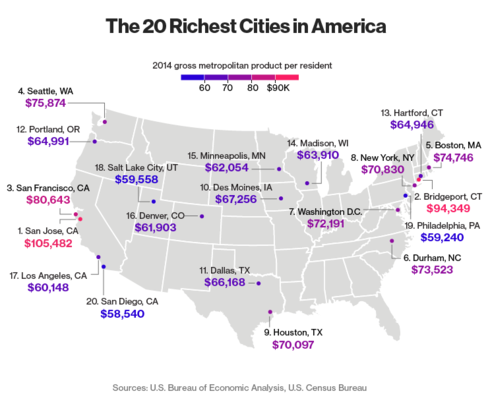
The San Jose, California metro area had the highest output per resident for 2014, according to a Bloomberg analysis of U.S. Bureau of Economic Analysis data for the 100 largest metropolitan areas. Gross metropolitan product (GMP) per capita in the Silicon Valley epicenter was $105,482, more than double the national average. Bridgeport, Connecticut ranked second at $94,349. San Francisco, Seattle and Boston followed.
These GMP per capita figures help uncover underlying economic trends, which are often masked by the population inflows and outflows that affect unadjusted output statistics. The 2014 rankings highlight a surge in tech centers since the recession, with San Jose now producing about $11,000 more per person than No. 2 Bridgeport. Until 2011, the Connecticut suburb for New York bankers held the top spot.
It’s no surprise that these high-output cities also have some of the densest concentrations of educated workers, reflecting the soaring returns to schooling in today’s job market. Harvard University professor Edward Glaeser says the diverging fates of high-skilled and low-skilled regions has been one of the most significant trends in the U.S. economy as well as other developed economies over the last three decades.
There’s an ”ongoing trend towards skilled places being far more compensated than non-skilled places,” said Glaeser, whose research focuses on what causes cities to grow. “The poster-child of this in the data is the San Jose metropolitan area, which is off the charts in terms of income growth.”
Tech cities outside the Bay Area have also benefited from the industry’s boom. Helped by not only Amazon Inc. but also newer Internet companies like Zulily Inc., Seattle’s GMP per capita grew by a cumulative 7.9 percent since 2009, when the economic recovery began. (The cumulative growth since 2008 is a much more tempered 2.5 percent because of the dramatic drop in the financial crisis.) That helped the Washington city catapult to No. 4 from its No. 6 spot in 2008 through 2011. Biotech hotbed Boston also jumped two places since 2008, while Portland, Oregon (sometimes called Silicon Forest) climbed six spots.
These emerging tech hubs will probably expand even more in coming years, according to Luis Torres, a research economist specializing in regional economies at the Texas A&M Real Estate Center. Sky-high rents in northern California force workers and businesses to look elsewhere, Torres said.
Methodology: Bloomberg ranked the 100 biggest metropolitan statistical areas (MSA) in the U.S. according to their gross metropolitan product per resident from 2008 to 2014, calculated with data from the U.S. Bureau of Economic Analysis and the U.S. Census Bureau. Data for 2014 were advance statistics and subject to future revision. Previous years’ data were revised from previous releases. The map above only displays the primary city in each MSA.
1. San Jose, CA $105,482
2. Bridgeport, CT $94,349
3. San Francisco, CA $80,643
4. Seattle, WA $75,874
5. Boston, MA $74,746
6. Durham, NC $73,523
7. Washington, DC $72,191
8. New York, NY $70,830
9. Houston, TX $70,097
10. Des Moines, IA $67,256
11. Dallas, TX $66,168
12. Portland, OR $64,991
13. Hartford, CT $64,946
14. Madison, WI $63,910
15. Minneapolis, MN $62,054
16. Denver, CO $61,903
17. Los Angeles, CA $60,148
18. Salt Lake City, UT $59,558
19. Philadelphia, PA $59,240
20. San Diego, CA $58,540
