Unicorn companies percentage per category
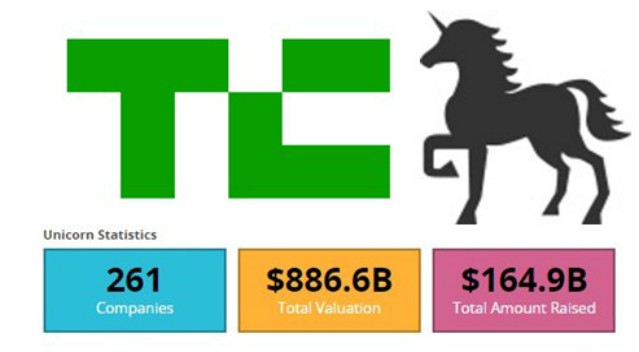
The following rates are based on the 261 Unicorn companies ranked and updated July 14, 2017
| Category | Total | % | ||
| Software | 41 | 15.71% | ||
| Consumer Internet | 39 | 14.94% | ||
| E-Commerce | 35 | 13.41% | ||
| Financial Services | 27 | 10.34% | ||
| Healthcare | twenty one | 8.05% | ||
| Entertainment | 13 | 4.98% | ||
| Enterprise | 9 | 3.45% | ||
| Hardware | 9 | 3.45% | ||
| Real Estate | 9 | 3.45% | ||
| Education | 6 | 2.30% | ||
| Security | 5 | 1.92% | ||
| Advertising | 4 | 1.53% | ||
| Food and Beverage | 4 | 1.53% | ||
| Aerospace and Defense | 3 | 1.15% | ||
| Auto | 3 | 1.15% | ||
| Analytics | 2 | 0.77% | ||
| Artificial Intelligence | 2 | 0.77% | ||
| Travel | 2 | 0.77% | ||
| Construction | 1 | 0.38% | ||
| energy | 1 | 0.38% | ||
| Fashion | 1 | 0.38% | ||
| FinTech | 1 | 0.38% | ||
| Search Engine | 1 | 0.38% | ||
| Manufacturing | 1 | 0.38% | ||
| Nanotechnology | 1 | 0.38% |