Top 100 Best STEM Schools – US News & World Report – 10/100
Top 100 Best STEM Schools – US News & World Report – 10/100

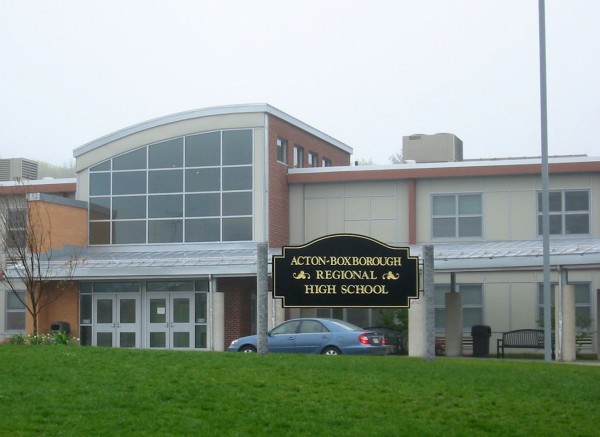
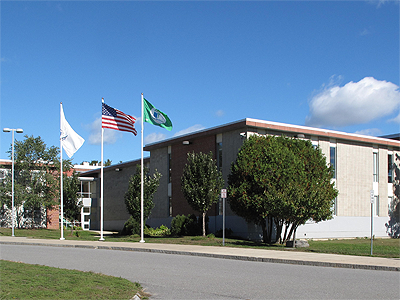
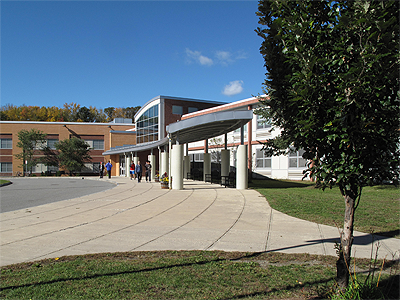
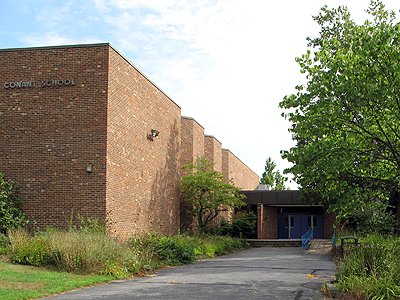
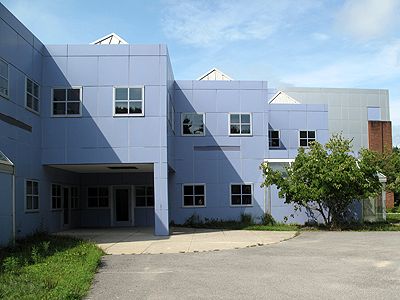
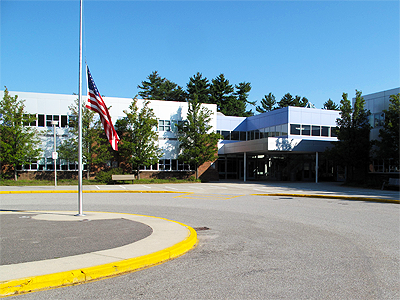
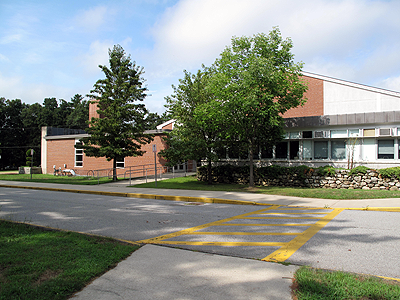
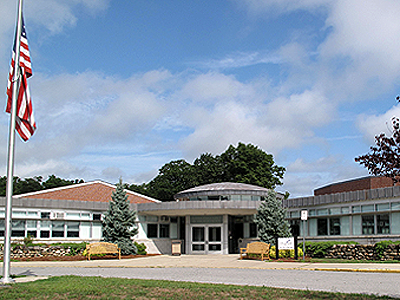
Acton-Boxborough Regional High School
36 CHARTER RD
ACTON, MA 01720
Phone: (978) 264-4700
District: Acton-Boxborough
Overview
Acton-Boxborough Regional High School is ranked 17th within Massachusetts. Students have the opportunity to take Advanced Placement® course work and exams. The AP® participation rate at Acton-Boxborough Regional High School is 55 percent. The student body makeup is 52 percent male and 48 percent female, and the total minority enrollment is 28 percent. Acton-Boxborough Regional High School is the only high school in the Acton-Boxborough.
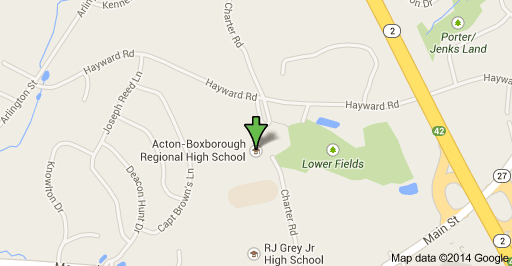
Local Map
Rankings / Awards
This details how this school compares to others based on U.S. News ranking criteria.
Medal Awarded Gold
National Rank
#324
State Rank
#17
STEM Rank
#10
See Best High Schools in Massachusetts
Students / Teachers
These counts and percentages of students and teachers are from data reported by schools to the government.
Total Enrollment 1,990
Total Minority Enrollment (% of total) 28%
Total Economically Disadvantaged (% of total) 2%
Full-Time Teachers 119
More About Student Body
Test Scores
U.S. News calculates these values based on student performance on state exit exams and internationally available exams on college-level course work (AP®/IB exams).
Proficient in English 98%
Proficient in Math 97%
College Readiness Index 53.2
More About Test Scores
School Data
School profile information is based on government data.
Grades Served 09 – 12
Setting Large Suburb
Charter School No
Magnet School No
Receives Title I Funding No
District
This information relates to high schools run by this school’s state operating agency. Many districts contain only one high school.
Total Schools 1
Total Students 1,990
Proficient in English (district average) 98%
Proficient in Math (district average) 97%
College Readiness (district average) 53.2
Class
These details on the school’s student body are based on data reported to the government.
Total Enrollment 1,990
9th Grade 513 Students
10th Grade 496 Students
11th Grade 474 Students
12th Grade 507 Students
Student Diversity
This is the breakdown of ethnicity and gender of a school’s student body, based on data reported to the government.
Ethnicity/Race
Total Minority Enrollment (% of total) 28%
American Indian/Alaskan Native Enrollment (% of total) 0.1%
Asian Enrollment (% of total) 22%
Black Enrollment (% of total) 1%
Hawaiian Native/Pacific Islander (% of total) 0%
Hispanic Enrollment (% of total) 3%
White Enrollment (% of total) 72%
Two or More Races Enrollment (% of total) 2%
Gender
Male (% of total) 52%
Female (% of total) 48%
Economically Disadvantaged Students
These are the percentages of the school’s students eligible for free or reduced-price lunch, based on data reported to the government.
Free Lunch Program (% of total) 2%
Reduced-Price Lunch Program (% of total) 0.4%
Total Economically Disadvantaged (% of total) 2%
Subject Proficiency Testing
Student exit exams receive grades among multiple proficiency levels established by the state. These figures display how the school as a whole performed in different subjects.
English Proficiency Distribution
English proficiency is determined by student results on the school’s Massachusetts Comprehensive Assessment System test.
Total Students Tested 484
Failing 1%
Needs Improvement 2%
Proficient 37%
Advanced 61%
Math Proficiency Distribution
Math proficiency is determined by student results on the school’s Massachusetts Comprehensive Assessment System test.
Total Students Tested 483
Failing 1%
Needs Improvement 3%
Proficient 10%
Advanced 87%
Overall Student Performance
This measures overall student performance on state exams. The calculations by U.S. News were the first of two steps in determining which schools received at least a bronze medal.
State Test Performance Index 135.7
Risk-Adjusted Performance Index 8.9
Disadvantaged Student Performance
This measures the proficiency on state exams among typically underperforming subgroups. The calculations by U.S. News were the second of two steps in determining which schools received at least a bronze medal.
Percentage of Disadvantaged Students Who Are Proficient 85.5
Percentage of Non-Disadvantaged Students Who Are Proficient 97.5
Gap Between Disadvantaged and Non-Disadvantaged Students -12.0
Gap Between School and State Among Disadvantaged Students 22.4
College-Ready Student Performance
High school students take AP® and IB exams to earn college credit and demonstrate success at college-level course work. U.S. News calculated a College Readiness Index based on exam participation rates and percentages of students passing at least one exam. The Index determined which types of medals (gold, silver or bronze) were awarded to top-performing schools.
College Readiness Index 53.2
Exam Used for Index AP®
Advanced Placement® (AP®) Student Performance
Many U.S. higher educational institutions grant credits or advanced placement based on student performance on AP® exams. This shows this school’s student participation and performance on these exams if data were available. (N/A means no students participated.)
Participation Rate 55%
Participant Passing Rate 96%
Exams Per Test Taker 3.1
Exam Pass Rate 97%
Quality-Adjusted Participation Rate 53%
Quality-Adjusted Exams Per Test Taker 3.1


“It is our fortune, as Actonians, to have such a phenomenal regional school district. My daughter is receiving a first class education at AB High School. She aspires to become a mechanical engineer in the future. I know that the rigor of the curriculum at AB will give her a running start for the demands of college.” – Dionne Gaynor-Seepersad
Source: US News & World Report